

seawater and exchangeable cations in the A p horizon soil and also the precipitation
of CaSO 4
. 2H 2 O and NaCl as the soils became dry.
Figure 6.4a, b show the distribution of the total thickness of the tsunami deposit
(mud plus sand) in Miyagi Prefecture and a close-up illustration of the Sendai Bay
area, respectively. The total thickness of the tsunami deposit tended to be thicker in
the area near the shoreline. The total thickness was very thin or zero near the inland
end of the tsunami-affected area. The sandy tsunami deposit was thicker near the
shore than in the inland area. The muddy deposit tended to be thick in the intermediate area. Separation of the sandy and muddy deposits is somewhat clear (Fig. 6.4c),
possibly because the suspension remained in the paddy field, where the ridge was
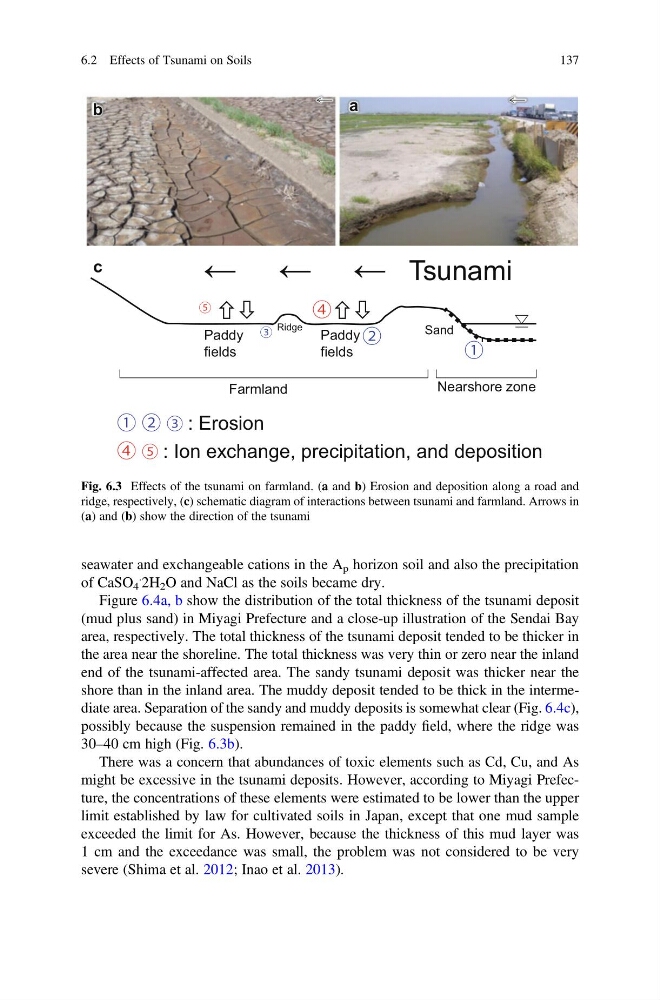
30–40 cm high (Fig. 6.3b).
There was a concern that abundances of toxic elements such as Cd, Cu, and As
might be excessive in the tsunami deposits. However, according to Miyagi Prefecture, the concentrations of these elements were estimated to be lower than the upper
limit established by law for cultivated soils in Japan, except that one mud sample
exceeded the limit for As. However, because the thickness of this mud layer was
1 cm and the exceedance was small, the problem was not considered to be very
severe (Shima et al. 2012; Inao et al. 2013).
Nearshore zone
Farmland
Sand
Paddy
fields
Ridge
Paddy
fields
← ← ← Tsunami
: Erosion
: Ion exchange, precipitation, and deposition
a
b
c
Fig. 6.3 Effects of the tsunami on farmland. (a and b) Erosion and deposition along a road and
ridge, respectively, (c) schematic diagram of interactions between tsunami and farmland. Arrows in
(a) and (b) show the direction of the tsunami
6.2 Effects of Tsunami on Soils
137
of CaSO 4
. 2H 2 O and NaCl as the soils became dry.
Figure 6.4a, b show the distribution of the total thickness of the tsunami deposit
(mud plus sand) in Miyagi Prefecture and a close-up illustration of the Sendai Bay
area, respectively. The total thickness of the tsunami deposit tended to be thicker in
the area near the shoreline. The total thickness was very thin or zero near the inland
end of the tsunami-affected area. The sandy tsunami deposit was thicker near the
shore than in the inland area. The muddy deposit tended to be thick in the intermediate area. Separation of the sandy and muddy deposits is somewhat clear (Fig. 6.4c),
possibly because the suspension remained in the paddy field, where the ridge was
30–40 cm high (Fig. 6.3b).
There was a concern that abundances of toxic elements such as Cd, Cu, and As
might be excessive in the tsunami deposits. However, according to Miyagi Prefecture, the concentrations of these elements were estimated to be lower than the upper
limit established by law for cultivated soils in Japan, except that one mud sample
exceeded the limit for As. However, because the thickness of this mud layer was
1 cm and the exceedance was small, the problem was not considered to be very
severe (Shima et al. 2012; Inao et al. 2013).
Nearshore zone
Farmland
Sand
Paddy
fields
Ridge
Paddy
fields
← ← ← Tsunami
: Erosion
: Ion exchange, precipitation, and deposition
a
b
c
Fig. 6.3 Effects of the tsunami on farmland. (a and b) Erosion and deposition along a road and
ridge, respectively, (c) schematic diagram of interactions between tsunami and farmland. Arrows in
(a) and (b) show the direction of the tsunami
6.2 Effects of Tsunami on Soils
137