

592
10 Particle Physics – II
(b) R ∼
c
mc 2 =
197 MeV − fm
100 × 10 3 MeV
= 2 × 10
−3 fm
10.96 M W
2
=
4πα
8 sin
2
θ W
·
√
2
(c)
3
G F
=
(4π )
8 sin
2 28.17 0
·
√
2
128
×
1
1.166 × 10 −5 = 6, 670
M W c
2
= 81.67 GeV
the experimental value being 81 GeV
M W /M Z = cos θ W → M Z = M W / cos θ W
M Z = 81.67/ cos 28.17
0
= 92.64 GeV
the experimental value being 94 GeV.
10.3.7 Feynman Diagrams
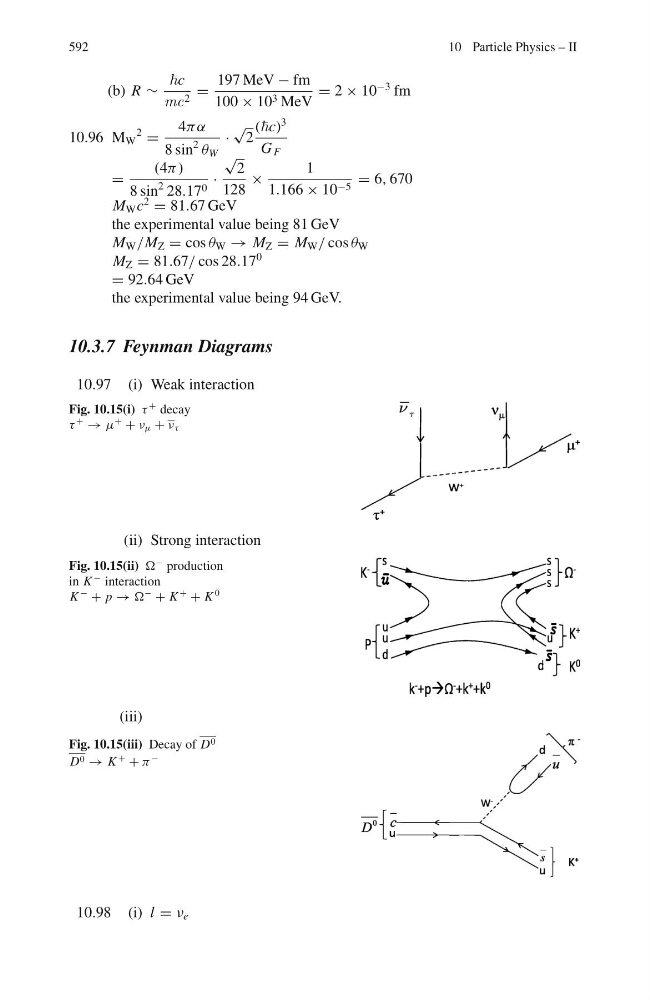
10.97 (i) Weak interaction
Fig. 10.15(i) τ
+ decay
τ
+ → μ
+ + ν μ + ν τ
(ii) Strong interaction
Fig. 10.15(ii) Ω
− production
in K
− interaction
K
− + p → Ω
− + K
+ + K
0
(iii)
Fig. 10.15(iii) Decay of D 0
D 0 → K
+
+ π
−
10.98 (i) l = ν e