

358
6 Special Theory of Relativity
From (3) and (4),(E max − E min )/(E max + E min ) = β
(5a)
From the measurement of E max and E min , the velocity of π
0 can be determined.
6.99 In the solution of Problem 6.98 multiply (3) and (4) and write E = γ m π c
2
m π c
2
= 2(E max E min )
1/2
(5b)
From the measurement of E max and E min , mass of π
0 can be determined.
It E max = 75 MeV and E min = 60 MeV, then mc
2
= 2 × (75 × 60)
1/2
=
134.16 MeV
Hence the mass of π
0 is 134.16/0.51 = 262.5m e
6.100 dN /dE = (dN /dΩ
∗ ).dΩ
∗
/dE = (1/4π).2 sin θ
∗ dθ
∗
/dE
= (1/2)d cos θ
∗
/dE
(6)
where we have put dΩ
∗
= 2π sin θ
∗ d θ
∗ for the element of solid angle and
dN /dΩ
∗
= 1/4π under the assumption of isotropy.
Differentiating (2) with respect to cos θ
∗
dE/d cos θ
∗
= γβmc
2
/2
or d cos θ
∗
/2dE = 1/γβmc
2
(7)
Combining (6) and (7), the normalized distribution is
dN /dE = 1/γβmc
2
= constant
(8)
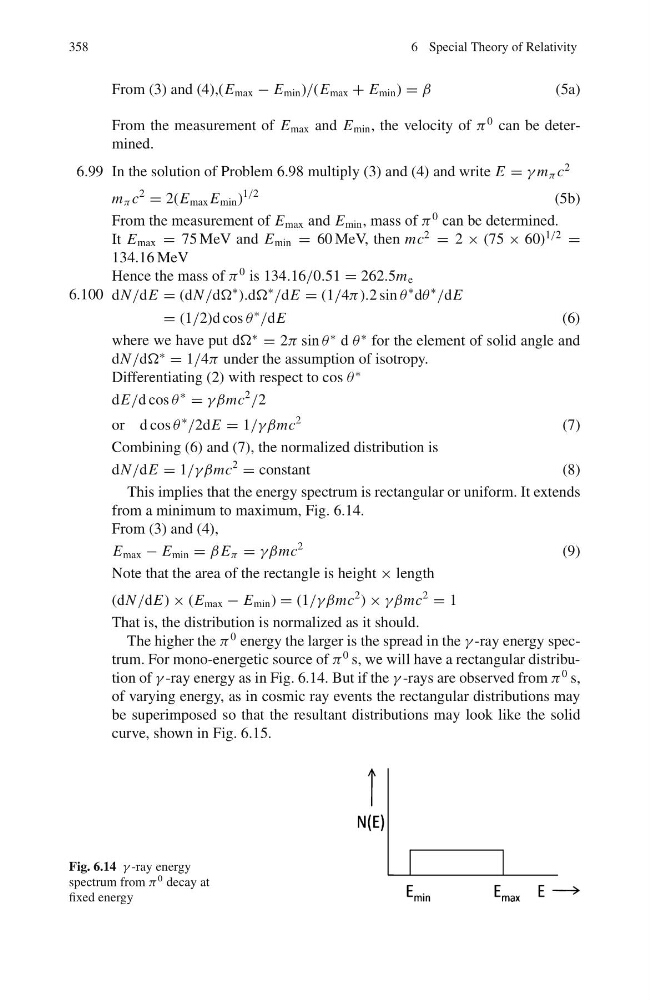
This implies that the energy spectrum is rectangular or uniform. It extends
from a minimum to maximum, Fig. 6.14.
From (3) and (4),
E max − E min = β E π = γβmc
2
(9)
Note that the area of the rectangle is height × length
(dN /dE) × (E max − E min ) = (1/γβmc
2 ) × γβmc
2
= 1
That is, the distribution is normalized as it should.
The higher the π
0 energy the larger is the spread in the γ -ray energy spectrum. For mono-energetic source of π
0 s, we will have a rectangular distribution of γ -ray energy as in Fig. 6.14. But if the γ -rays are observed from π
0 s,
of varying energy, as in cosmic ray events the rectangular distributions may
be superimposed so that the resultant distributions may look like the solid
curve, shown in Fig. 6.15.
Fig. 6.14 γ -ray energy
spectrum from π
0 decay at
fixed energy
6 Special Theory of Relativity
From (3) and (4),(E max − E min )/(E max + E min ) = β
(5a)
From the measurement of E max and E min , the velocity of π
0 can be determined.
6.99 In the solution of Problem 6.98 multiply (3) and (4) and write E = γ m π c
2
m π c
2
= 2(E max E min )
1/2
(5b)
From the measurement of E max and E min , mass of π
0 can be determined.
It E max = 75 MeV and E min = 60 MeV, then mc
2
= 2 × (75 × 60)
1/2
=
134.16 MeV
Hence the mass of π
0 is 134.16/0.51 = 262.5m e
6.100 dN /dE = (dN /dΩ
∗ ).dΩ
∗
/dE = (1/4π).2 sin θ
∗ dθ
∗
/dE
= (1/2)d cos θ
∗
/dE
(6)
where we have put dΩ
∗
= 2π sin θ
∗ d θ
∗ for the element of solid angle and
dN /dΩ
∗
= 1/4π under the assumption of isotropy.
Differentiating (2) with respect to cos θ
∗
dE/d cos θ
∗
= γβmc
2
/2
or d cos θ
∗
/2dE = 1/γβmc
2
(7)
Combining (6) and (7), the normalized distribution is
dN /dE = 1/γβmc
2
= constant
(8)
This implies that the energy spectrum is rectangular or uniform. It extends
from a minimum to maximum, Fig. 6.14.
From (3) and (4),
E max − E min = β E π = γβmc
2
(9)
Note that the area of the rectangle is height × length
(dN /dE) × (E max − E min ) = (1/γβmc
2 ) × γβmc
2
= 1
That is, the distribution is normalized as it should.
The higher the π
0 energy the larger is the spread in the γ -ray energy spectrum. For mono-energetic source of π
0 s, we will have a rectangular distribution of γ -ray energy as in Fig. 6.14. But if the γ -rays are observed from π
0 s,
of varying energy, as in cosmic ray events the rectangular distributions may
be superimposed so that the resultant distributions may look like the solid
curve, shown in Fig. 6.15.
Fig. 6.14 γ -ray energy
spectrum from π
0 decay at
fixed energy