

is very useful, saving much time and effort in the synthesis and testing of new drugs.
Hundreds of examples of such analyses are available in the literature; many show positive predictive values for drug activity, whereas some other drug series cannot be interpreted by this method.
Regression analysis is currently the most widely used correlative method in drug
design. This is because it simplifies problems within a set of compounds by using a limited number of descriptors, notably the Hansch hydrophobic constant π, Hammet constants, or other electronic characteristics of substituents, and the Taft steric constant E S .
Nevertheless, there are several difficulties and pitfalls in using the Hansch method.
First, the inherent disadvantage of regression analysis is that one can obtain good fits
(r
2
> 0.9) simply by manipulating the constants. Therefore, curve fitting must be done
for a relatively large number of compounds to ensure that all predictors are considered.
Second, the mode of action may change for drugs within a seemingly continuous series,
invalidating the comparison of some compounds in the series with the predictor compounds. The Hansch method cannot anticipate such a change.
Other problems with the Hansch method are that biological systems are often too
crude as models for its application, or the electronic effects operative in a drug molecule are not sufficiently understood or precise. Finally, the method requires considerable time and expense, even in the hands of an expert. Difficulties notwithstanding, the
Hansch approach took both chemists and pharmacologists out of the dark age of pure
empiricism and allowed them to consider simultaneously the effects of a large number
of variables of drug activity—a feat unattainable with classical methods.
Nevertheless, Hansch analysis revolutionized drug molecule optimization and
directly led to two other strategies for molecule optimization: the Free–Wilson method
and the Topliss decision tree.
The Free–Wilson Method. This method also assumes that biological activity can be
described by the additive properties of the substituents on a basic molecular structure.
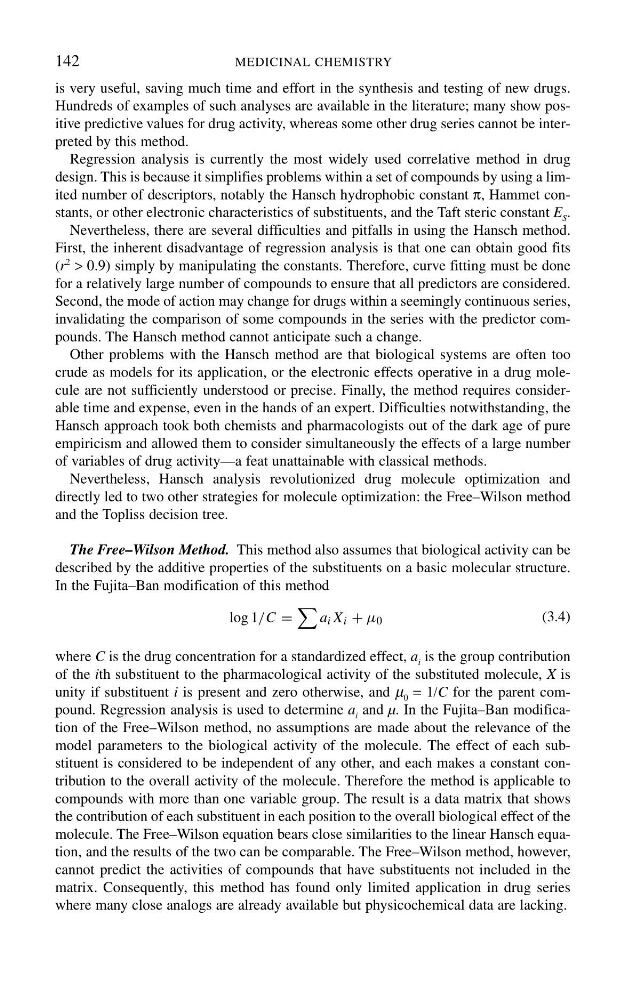
In the Fujita–Ban modification of this method
where C is the drug concentration for a standardized effect, a i is the group contribution
of the ith substituent to the pharmacological activity of the substituted molecule, X is
unity if substituent i is present and zero otherwise, and µ 0 = 1/C for the parent compound. Regression analysis is used to determine a i and µ. In the Fujita–Ban modification of the Free–Wilson method, no assumptions are made about the relevance of the
model parameters to the biological activity of the molecule. The effect of each substituent is considered to be independent of any other, and each makes a constant contribution to the overall activity of the molecule. Therefore the method is applicable to
compounds with more than one variable group. The result is a data matrix that shows
the contribution of each substituent in each position to the overall biological effect of the
molecule. The Free–Wilson equation bears close similarities to the linear Hansch equation, and the results of the two can be comparable. The Free–Wilson method, however,
cannot predict the activities of compounds that have substituents not included in the
matrix. Consequently, this method has found only limited application in drug series
where many close analogs are already available but physicochemical data are lacking.
142
MEDICINAL CHEMISTRY
log 1/C =
a i X i + µ 0
(3.4)
Hundreds of examples of such analyses are available in the literature; many show positive predictive values for drug activity, whereas some other drug series cannot be interpreted by this method.
Regression analysis is currently the most widely used correlative method in drug
design. This is because it simplifies problems within a set of compounds by using a limited number of descriptors, notably the Hansch hydrophobic constant π, Hammet constants, or other electronic characteristics of substituents, and the Taft steric constant E S .
Nevertheless, there are several difficulties and pitfalls in using the Hansch method.
First, the inherent disadvantage of regression analysis is that one can obtain good fits
(r
2
> 0.9) simply by manipulating the constants. Therefore, curve fitting must be done
for a relatively large number of compounds to ensure that all predictors are considered.
Second, the mode of action may change for drugs within a seemingly continuous series,
invalidating the comparison of some compounds in the series with the predictor compounds. The Hansch method cannot anticipate such a change.
Other problems with the Hansch method are that biological systems are often too
crude as models for its application, or the electronic effects operative in a drug molecule are not sufficiently understood or precise. Finally, the method requires considerable time and expense, even in the hands of an expert. Difficulties notwithstanding, the
Hansch approach took both chemists and pharmacologists out of the dark age of pure
empiricism and allowed them to consider simultaneously the effects of a large number
of variables of drug activity—a feat unattainable with classical methods.
Nevertheless, Hansch analysis revolutionized drug molecule optimization and
directly led to two other strategies for molecule optimization: the Free–Wilson method
and the Topliss decision tree.
The Free–Wilson Method. This method also assumes that biological activity can be
described by the additive properties of the substituents on a basic molecular structure.
In the Fujita–Ban modification of this method
where C is the drug concentration for a standardized effect, a i is the group contribution
of the ith substituent to the pharmacological activity of the substituted molecule, X is
unity if substituent i is present and zero otherwise, and µ 0 = 1/C for the parent compound. Regression analysis is used to determine a i and µ. In the Fujita–Ban modification of the Free–Wilson method, no assumptions are made about the relevance of the
model parameters to the biological activity of the molecule. The effect of each substituent is considered to be independent of any other, and each makes a constant contribution to the overall activity of the molecule. Therefore the method is applicable to
compounds with more than one variable group. The result is a data matrix that shows
the contribution of each substituent in each position to the overall biological effect of the
molecule. The Free–Wilson equation bears close similarities to the linear Hansch equation, and the results of the two can be comparable. The Free–Wilson method, however,
cannot predict the activities of compounds that have substituents not included in the
matrix. Consequently, this method has found only limited application in drug series
where many close analogs are already available but physicochemical data are lacking.
142
MEDICINAL CHEMISTRY
log 1/C =
a i X i + µ 0
(3.4)