

drug molecule’s solubility. It reflects the ability of the drug to partition itself into the
lipid surroundings of the receptor microenvironment.
Introduced by Corwin Hansch in the early 1960s, Hansch analysis considers both the
physicochemical aspects of drug distribution from the point of application to the point
of effect and the drug–receptor interaction. In a given group of drugs that have analogous
structures and act by the same mechanism, three parameters seem to play a major role:
1. The substituent hydrophobicity constant, based on partition coefficients analogs to
Hammet constants:
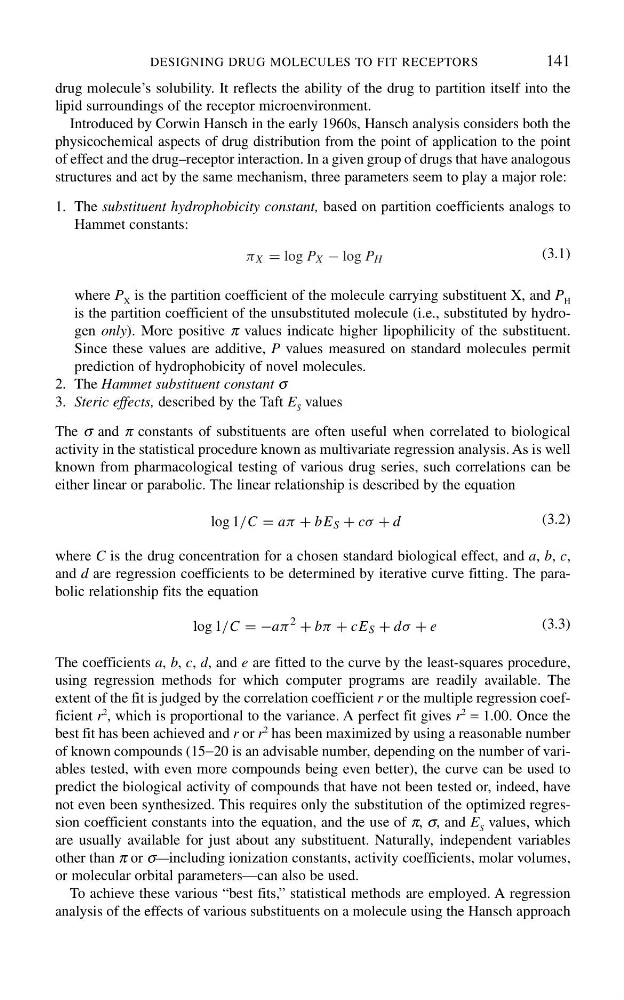
where P X is the partition coefficient of the molecule carrying substituent X, and P H
is the partition coefficient of the unsubstituted molecule (i.e., substituted by hydrogen only). More positive π values indicate higher lipophilicity of the substituent.
Since these values are additive, P values measured on standard molecules permit
prediction of hydrophobicity of novel molecules.
2. The Hammet substituent constant σ
3. Steric effects, described by the Taft E S values
The σ and π constants of substituents are often useful when correlated to biological
activity in the statistical procedure known as multivariate regression analysis. As is well
known from pharmacological testing of various drug series, such correlations can be
either linear or parabolic. The linear relationship is described by the equation
where C is the drug concentration for a chosen standard biological effect, and a, b, c,
and d are regression coefficients to be determined by iterative curve fitting. The parabolic relationship fits the equation
The coefficients a, b, c, d, and e are fitted to the curve by the least-squares procedure,
using regression methods for which computer programs are readily available. The
extent of the fit is judged by the correlation coefficient r or the multiple regression coefficient r
2
, which is proportional to the variance. A perfect fit gives r
2
= 1.00. Once the
best fit has been achieved and r or r
2 has been maximized by using a reasonable number
of known compounds (15−20 is an advisable number, depending on the number of variables tested, with even more compounds being even better), the curve can be used to
predict the biological activity of compounds that have not been tested or, indeed, have
not even been synthesized. This requires only the substitution of the optimized regression coefficient constants into the equation, and the use of π, σ, and E S values, which
are usually available for just about any substituent. Naturally, independent variables
other than π or σ—including ionization constants, activity coefficients, molar volumes,
or molecular orbital parameters—can also be used.
To achieve these various “best fits,” statistical methods are employed. A regression
analysis of the effects of various substituents on a molecule using the Hansch approach
DESIGNING DRUG MOLECULES TO FIT RECEPTORS
141
π X = log P X − log P H
(3.1)
log 1/C = aπ + bE S + cσ + d
(3.2)
log 1/C = −aπ
2
+ bπ + cE S + dσ + e
(3.3)
lipid surroundings of the receptor microenvironment.
Introduced by Corwin Hansch in the early 1960s, Hansch analysis considers both the
physicochemical aspects of drug distribution from the point of application to the point
of effect and the drug–receptor interaction. In a given group of drugs that have analogous
structures and act by the same mechanism, three parameters seem to play a major role:
1. The substituent hydrophobicity constant, based on partition coefficients analogs to
Hammet constants:
where P X is the partition coefficient of the molecule carrying substituent X, and P H
is the partition coefficient of the unsubstituted molecule (i.e., substituted by hydrogen only). More positive π values indicate higher lipophilicity of the substituent.
Since these values are additive, P values measured on standard molecules permit
prediction of hydrophobicity of novel molecules.
2. The Hammet substituent constant σ
3. Steric effects, described by the Taft E S values
The σ and π constants of substituents are often useful when correlated to biological
activity in the statistical procedure known as multivariate regression analysis. As is well
known from pharmacological testing of various drug series, such correlations can be
either linear or parabolic. The linear relationship is described by the equation
where C is the drug concentration for a chosen standard biological effect, and a, b, c,
and d are regression coefficients to be determined by iterative curve fitting. The parabolic relationship fits the equation
The coefficients a, b, c, d, and e are fitted to the curve by the least-squares procedure,
using regression methods for which computer programs are readily available. The
extent of the fit is judged by the correlation coefficient r or the multiple regression coefficient r
2
, which is proportional to the variance. A perfect fit gives r
2
= 1.00. Once the
best fit has been achieved and r or r
2 has been maximized by using a reasonable number
of known compounds (15−20 is an advisable number, depending on the number of variables tested, with even more compounds being even better), the curve can be used to
predict the biological activity of compounds that have not been tested or, indeed, have
not even been synthesized. This requires only the substitution of the optimized regression coefficient constants into the equation, and the use of π, σ, and E S values, which
are usually available for just about any substituent. Naturally, independent variables
other than π or σ—including ionization constants, activity coefficients, molar volumes,
or molecular orbital parameters—can also be used.
To achieve these various “best fits,” statistical methods are employed. A regression
analysis of the effects of various substituents on a molecule using the Hansch approach
DESIGNING DRUG MOLECULES TO FIT RECEPTORS
141
π X = log P X − log P H
(3.1)
log 1/C = aπ + bE S + cσ + d
(3.2)
log 1/C = −aπ
2
+ bπ + cE S + dσ + e
(3.3)