

230
Chemical Kinetics
the exponent to which the concentration of the reactant is raised in the empirical
rate expression. Thus, if the empirical rate expression is
V =
we say that it is a third-order reaction (a + b = 3) that is second order in A (a =
2) and first order in B (b = 1). If C is also a reactant but its concentration does
not appear in the rate expression, then we say that the reaction is zero order in
C (c = 0).
HOW CONCENTRATIONS CHANGE WITH TIME
The experimental problem is to find (at a given temperature) the order of the
reaction and the reactants and the value of A:. Assume for the moment that there
is a way to determine [AJ as a function of time (?) after mixing the reactants.
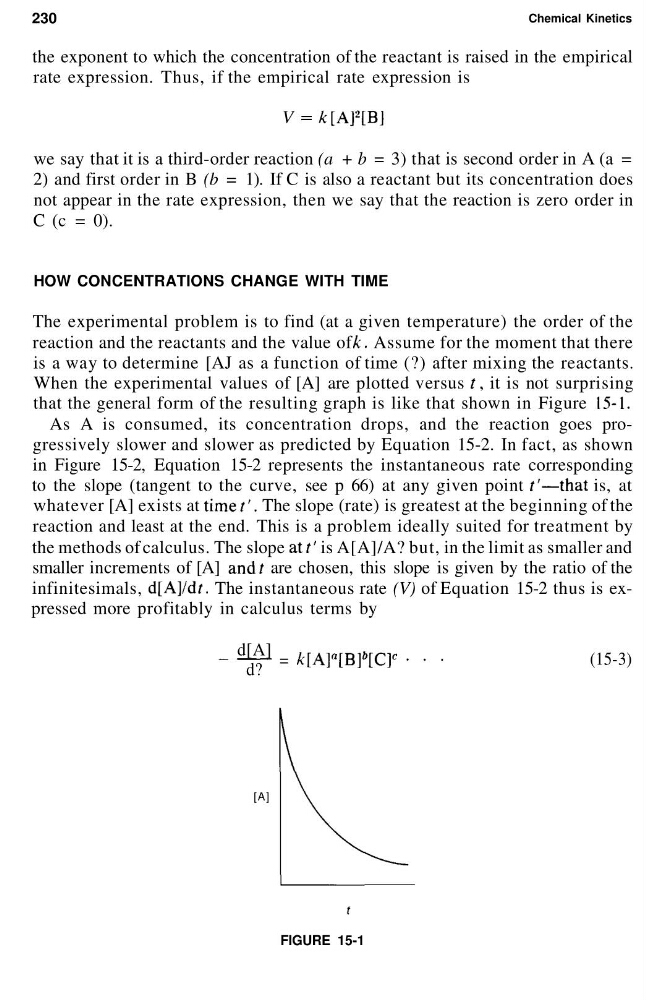
When the experimental values of [A] are plotted versus ?, it is not surprising
that the general form of the resulting graph is like that shown in Figure 15-1.
As A is consumed, its concentration drops, and the reaction goes progressively slower and slower as predicted by Equation 15-2. In fact, as shown
in Figure 15-2, Equation 15-2 represents the instantaneous rate corresponding
to the slope (tangent to the curve, see p 66) at any given point t'—that is, at
whatever [A] exists at time?'. The slope (rate) is greatest at the beginning of the
reaction and least at the end. This is a problem ideally suited for treatment by
the methods of calculus. The slope at/' is A[A]/A? but, in the limit as smaller and
smaller increments of [A] and? are chosen, this slope is given by the ratio of the
infinitesimals, d[A]/d?. The instantaneous rate (V) of Equation 15-2 thus is expressed more profitably in calculus terms by
d[A]
d?
= A:[A]
a [B]»[C]
c
(15-3)
[A]
FIGURE 15-1
Chemical Kinetics
the exponent to which the concentration of the reactant is raised in the empirical
rate expression. Thus, if the empirical rate expression is
V =
we say that it is a third-order reaction (a + b = 3) that is second order in A (a =
2) and first order in B (b = 1). If C is also a reactant but its concentration does
not appear in the rate expression, then we say that the reaction is zero order in
C (c = 0).
HOW CONCENTRATIONS CHANGE WITH TIME
The experimental problem is to find (at a given temperature) the order of the
reaction and the reactants and the value of A:. Assume for the moment that there
is a way to determine [AJ as a function of time (?) after mixing the reactants.
When the experimental values of [A] are plotted versus ?, it is not surprising
that the general form of the resulting graph is like that shown in Figure 15-1.
As A is consumed, its concentration drops, and the reaction goes progressively slower and slower as predicted by Equation 15-2. In fact, as shown
in Figure 15-2, Equation 15-2 represents the instantaneous rate corresponding
to the slope (tangent to the curve, see p 66) at any given point t'—that is, at
whatever [A] exists at time?'. The slope (rate) is greatest at the beginning of the
reaction and least at the end. This is a problem ideally suited for treatment by
the methods of calculus. The slope at/' is A[A]/A? but, in the limit as smaller and
smaller increments of [A] and? are chosen, this slope is given by the ratio of the
infinitesimals, d[A]/d?. The instantaneous rate (V) of Equation 15-2 thus is expressed more profitably in calculus terms by
d[A]
d?
= A:[A]
a [B]»[C]
c
(15-3)
[A]
FIGURE 15-1