

Part II: The Answers
398
Answers
601–700
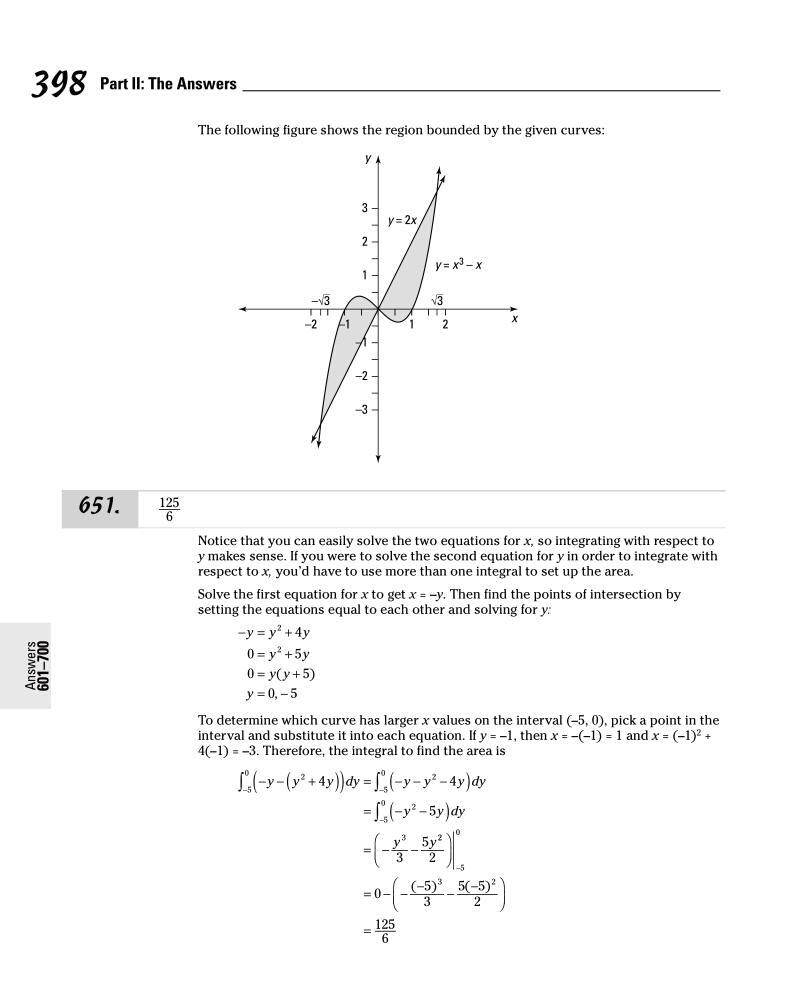
The following figure shows the region bounded by the given curves:
651.
125
6
Notice that you can easily solve the two equations for x, so integrating with respect to
y makes sense. If you were to solve the second equation for y in order to integrate with
respect to x, you’d have to use more than one integral to set up the area.
Solve the first equation for x to get x = –y. Then find the points of intersection by
setting the equations equal to each other and solving for y:
− =
+
=
+
=
+
= −
y y
y
y
y
y y
y
2
2
4
0
5
0
5
0 5
(
)
,
To determine which curve has larger x values on the interval (–5, 0), pick a point in the
interval and substitute it into each equation. If y = –1, then x = –(–1) = 1 and x = (–1)
2
+
4(–1) = –3. Therefore, the integral to find the area is
− −
+
(
)
(
) = − − −
(
)
=
− −
(
)
= −
−
−
−
−
∫
∫
∫
y y
y dy
y y
y dy
y
y dy
y
y
2
5
0
2
5
0
2
5
0
3
4
4
5
3
5
2 2
5
0
3
2
2
0
5
3
5 5
2
125
6
= − −
−
−
−
=
−
( )
( )
398
Answers
601–700
The following figure shows the region bounded by the given curves:
651.
125
6
Notice that you can easily solve the two equations for x, so integrating with respect to
y makes sense. If you were to solve the second equation for y in order to integrate with
respect to x, you’d have to use more than one integral to set up the area.
Solve the first equation for x to get x = –y. Then find the points of intersection by
setting the equations equal to each other and solving for y:
− =
+
=
+
=
+
= −
y y
y
y
y
y y
y
2
2
4
0
5
0
5
0 5
(
)
,
To determine which curve has larger x values on the interval (–5, 0), pick a point in the
interval and substitute it into each equation. If y = –1, then x = –(–1) = 1 and x = (–1)
2
+
4(–1) = –3. Therefore, the integral to find the area is
− −
+
(
)
(
) = − − −
(
)
=
− −
(
)
= −
−
−
−
−
∫
∫
∫
y y
y dy
y y
y dy
y
y dy
y
y
2
5
0
2
5
0
2
5
0
3
4
4
5
3
5
2 2
5
0
3
2
2
0
5
3
5 5
2
125
6
= − −
−
−
−
=
−
( )
( )