

The relationship is certainly linear, as each additional widget sold produces the same increase of $15 in
profit made. This relationship has slope 15. Notice that
in selling two additional widgets, profit is increased by
$30, and in selling three additional widgets, profit
increases by $45, and so on. In particular, the ratio of
profit increase to production increase is always the
same:
=
= 15. In general, if two quantities x and
y are linearly related, the slope of the relationship is
computed as:
In particular, if the value x 1 produces the output value
y 1 and x 2 the output y 2 , then:
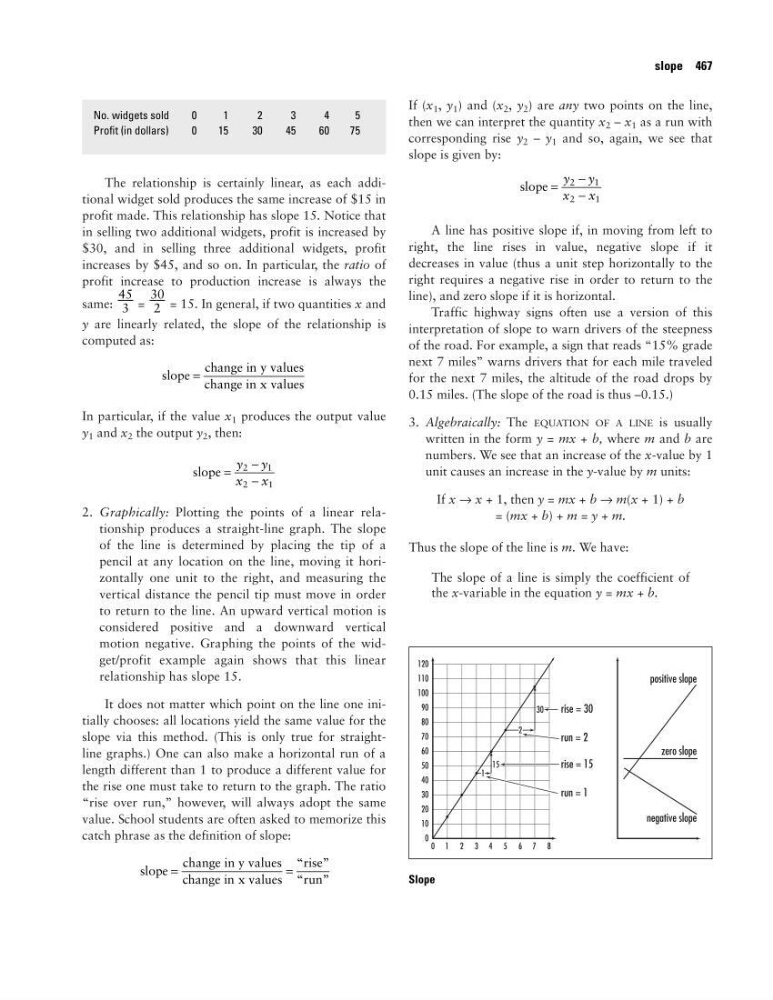
2. Graphically: Plotting the points of a linear relationship produces a straight-line graph. The slope
of the line is determined by placing the tip of a
pencil at any location on the line, moving it horizontally one unit to the right, and measuring the
vertical distance the pencil tip must move in order
to return to the line. An upward vertical motion is
considered positive and a downward vertical
motion negative. Graphing the points of the widget/profit example again shows that this linear
relationship has slope 15.
It does not matter which point on the line one initially chooses: all locations yield the same value for the
slope via this method. (This is only true for straightline graphs.) One can also make a horizontal run of a
length different than 1 to produce a different value for
the rise one must take to return to the graph. The ratio
“rise over run,” however, will always adopt the same
value. School students are often asked to memorize this
catch phrase as the definition of slope:
If (x 1 , y 1 ) and (x 2 , y 2 ) are any two points on the line,
then we can interpret the quantity x 2 – x 1 as a run with
corresponding rise y 2 – y 1 and so, again, we see that
slope is given by:
A line has positive slope if, in moving from left to
right, the line rises in value, negative slope if it
decreases in value (thus a unit step horizontally to the
right requires a negative rise in order to return to the
line), and zero slope if it is horizontal.
Traffic highway signs often use a version of this
interpretation of slope to warn drivers of the steepness
of the road. For example, a sign that reads “15% grade
next 7 miles” warns drivers that for each mile traveled
for the next 7 miles, the altitude of the road drops by
0.15 miles. (The slope of the road is thus –0.15.)
3. Algebraically: The EQUATION OF A LINE is usually
written in the form y = mx + b, where m and b are
numbers. We see that an increase of the x-value by 1
unit causes an increase in the y-value by m units:
If x → x + 1, then y = mx + b → m(x + 1) + b
= (mx + b) + m = y + m.
Thus the slope of the line is m. We have:
The slope of a line is simply the coefficient of
the x-variable in the equation y = mx + b.
slope =
−
−
y y
x x
2
1
2
1
slope
change in y values
change in x values
“rise”
“run”
=
=
slope =
−
−
y y
x x
2
1
2
1
slope
change in y values
change in x values
=
30
––
2
45
––
3
slope 467
No. widgets sold
0
1
2
3
4
5
Profit (in dollars)
0
15
30
45
60
75
Slope
profit made. This relationship has slope 15. Notice that
in selling two additional widgets, profit is increased by
$30, and in selling three additional widgets, profit
increases by $45, and so on. In particular, the ratio of
profit increase to production increase is always the
same:
=
= 15. In general, if two quantities x and
y are linearly related, the slope of the relationship is
computed as:
In particular, if the value x 1 produces the output value
y 1 and x 2 the output y 2 , then:
2. Graphically: Plotting the points of a linear relationship produces a straight-line graph. The slope
of the line is determined by placing the tip of a
pencil at any location on the line, moving it horizontally one unit to the right, and measuring the
vertical distance the pencil tip must move in order
to return to the line. An upward vertical motion is
considered positive and a downward vertical
motion negative. Graphing the points of the widget/profit example again shows that this linear
relationship has slope 15.
It does not matter which point on the line one initially chooses: all locations yield the same value for the
slope via this method. (This is only true for straightline graphs.) One can also make a horizontal run of a
length different than 1 to produce a different value for
the rise one must take to return to the graph. The ratio
“rise over run,” however, will always adopt the same
value. School students are often asked to memorize this
catch phrase as the definition of slope:
If (x 1 , y 1 ) and (x 2 , y 2 ) are any two points on the line,
then we can interpret the quantity x 2 – x 1 as a run with
corresponding rise y 2 – y 1 and so, again, we see that
slope is given by:
A line has positive slope if, in moving from left to
right, the line rises in value, negative slope if it
decreases in value (thus a unit step horizontally to the
right requires a negative rise in order to return to the
line), and zero slope if it is horizontal.
Traffic highway signs often use a version of this
interpretation of slope to warn drivers of the steepness
of the road. For example, a sign that reads “15% grade
next 7 miles” warns drivers that for each mile traveled
for the next 7 miles, the altitude of the road drops by
0.15 miles. (The slope of the road is thus –0.15.)
3. Algebraically: The EQUATION OF A LINE is usually
written in the form y = mx + b, where m and b are
numbers. We see that an increase of the x-value by 1
unit causes an increase in the y-value by m units:
If x → x + 1, then y = mx + b → m(x + 1) + b
= (mx + b) + m = y + m.
Thus the slope of the line is m. We have:
The slope of a line is simply the coefficient of
the x-variable in the equation y = mx + b.
slope =
−
−
y y
x x
2
1
2
1
slope
change in y values
change in x values
“rise”
“run”
=
=
slope =
−
−
y y
x x
2
1
2
1
slope
change in y values
change in x values
=
30
––
2
45
––
3
slope 467
No. widgets sold
0
1
2
3
4
5
Profit (in dollars)
0
15
30
45
60
75
Slope