

Soderi, Mucchi, Hämäläinen, Piva, and Iinatti
132
In order to compare the proposed protocol against the iJAM, we computed
the P out
iJAM
as
P
e
e e d d
out
iJAM
v k
je
=1
=
0
1
=1
1
.
2
e
k
k
v
je
je
je te
(6.23)
Figure 6.9 shows the comparison between the WBPLSec and the iJAM with equal
energy per symbol, that is E S . Observe that the proposed protocol has better P out than
iJAM. On average, WBPLSec has P out two times better than iJAM, comparing curves in
Figure 6.9 with same E J . Moreover, the higher is the E J , the lower is P out that yields to
increase the performance of the proposed protocol. The scenario depicted in Figure 6.9
assumes Eve in the middle between Alice and Bob.
Due to the jamming strategy implemented in the WBPLSec, Figure 6.10 shows the
effect over P out varying the number of jammed samples. Once more, the figure also
depicts the P out for the same scenario achieved with iJAM, that is when M N W 1024
samples are jammed, that yields to have E E
J
W
E S
=
= 4 . As illustrated in Figure 6.10, the
more jammed samples per symbol exist, that is higher E J , the less is the P out . Thus, by
controlling the value of E J , the receiver can control the target secrecy level.
−15
−10
−5
0
5
10
−15
−10
−5
0
5
10
15
20
25
γ M [dB]
Distance [m]
0.9
0.8
0.7
0.6
0.5
0.4
0.3
0.2
0.1
P out
EVE
BOB
ALICE
NEAR−FIELD REGION
1
16
E S
P out of C s , E J =
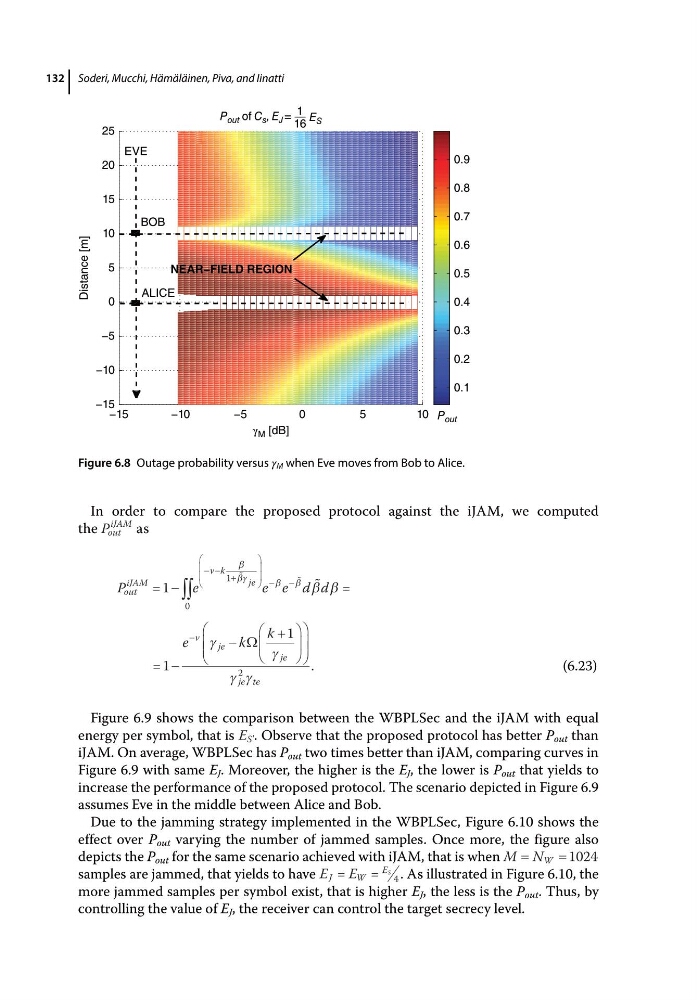
Figure 6.8 Outage probability versus γ M when Eve moves from Bob to Alice.
132
In order to compare the proposed protocol against the iJAM, we computed
the P out
iJAM
as
P
e
e e d d
out
iJAM
v k
je
=1
=
0
1
=1
1
.
2
e
k
k
v
je
je
je te
(6.23)
Figure 6.9 shows the comparison between the WBPLSec and the iJAM with equal
energy per symbol, that is E S . Observe that the proposed protocol has better P out than
iJAM. On average, WBPLSec has P out two times better than iJAM, comparing curves in
Figure 6.9 with same E J . Moreover, the higher is the E J , the lower is P out that yields to
increase the performance of the proposed protocol. The scenario depicted in Figure 6.9
assumes Eve in the middle between Alice and Bob.
Due to the jamming strategy implemented in the WBPLSec, Figure 6.10 shows the
effect over P out varying the number of jammed samples. Once more, the figure also
depicts the P out for the same scenario achieved with iJAM, that is when M N W 1024
samples are jammed, that yields to have E E
J
W
E S
=
= 4 . As illustrated in Figure 6.10, the
more jammed samples per symbol exist, that is higher E J , the less is the P out . Thus, by
controlling the value of E J , the receiver can control the target secrecy level.
−15
−10
−5
0
5
10
−15
−10
−5
0
5
10
15
20
25
γ M [dB]
Distance [m]
0.9
0.8
0.7
0.6
0.5
0.4
0.3
0.2
0.1
P out
EVE
BOB
ALICE
NEAR−FIELD REGION
1
16
E S
P out of C s , E J =
Figure 6.8 Outage probability versus γ M when Eve moves from Bob to Alice.