

176
R. Sundaram et al.
3.5 Removal of Nitrate from Drinking Water in Pilot Scale
Study
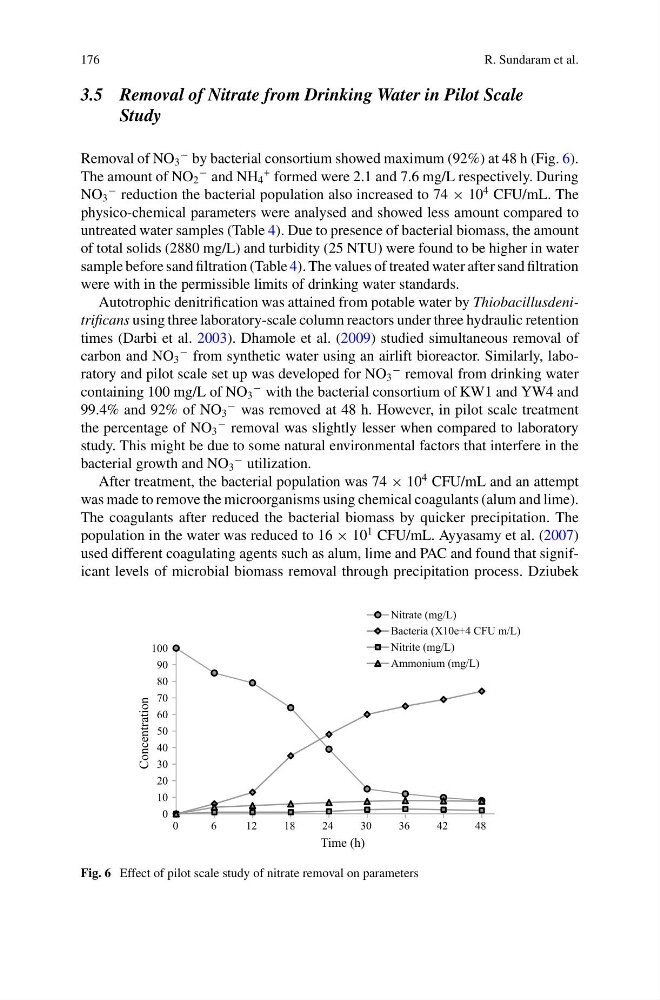
Removal of NO 3
− by bacterial consortium showed maximum (92%) at 48 h (Fig. 6).
The amount of NO 2
− and NH 4
+ formed were 2.1 and 7.6 mg/L respectively. During
NO 3
− reduction the bacterial population also increased to 74 × 10
4 CFU/mL. The
physico-chemical parameters were analysed and showed less amount compared to
untreated water samples (Table 4). Due to presence of bacterial biomass, the amount
of total solids (2880 mg/L) and turbidity (25 NTU) were found to be higher in water
sample before sand filtration (Table 4). The values of treated water after sand filtration
were with in the permissible limits of drinking water standards.
Autotrophic denitrification was attained from potable water by Thiobacillusdenitrificans using three laboratory-scale column reactors under three hydraulic retention
times (Darbi et al. 2003). Dhamole et al. (2009) studied simultaneous removal of
carbon and NO 3
− from synthetic water using an airlift bioreactor. Similarly, laboratory and pilot scale set up was developed for NO 3
− removal from drinking water
containing 100 mg/L of NO 3
− with the bacterial consortium of KW1 and YW4 and
99.4% and 92% of NO 3
− was removed at 48 h. However, in pilot scale treatment
the percentage of NO 3
− removal was slightly lesser when compared to laboratory
study. This might be due to some natural environmental factors that interfere in the
bacterial growth and NO 3
− utilization.
After treatment, the bacterial population was 74 × 10
4 CFU/mL and an attempt
was made to remove the microorganisms using chemical coagulants (alum and lime).
The coagulants after reduced the bacterial biomass by quicker precipitation. The
population in the water was reduced to 16 × 10
1 CFU/mL. Ayyasamy et al. (2007)
used different coagulating agents such as alum, lime and PAC and found that significant levels of microbial biomass removal through precipitation process. Dziubek
0
10
20
30
40
50
60
70
80
90
100
0
6
12
18
24
30
36
42
48
Concentration
Time (h)
Nitrate (mg/L)
Bacteria (X10e+4 CFU m/L)
Nitrite (mg/L)
Ammonium (mg/L)
Fig. 6 Effect of pilot scale study of nitrate removal on parameters
R. Sundaram et al.
3.5 Removal of Nitrate from Drinking Water in Pilot Scale
Study
Removal of NO 3
− by bacterial consortium showed maximum (92%) at 48 h (Fig. 6).
The amount of NO 2
− and NH 4
+ formed were 2.1 and 7.6 mg/L respectively. During
NO 3
− reduction the bacterial population also increased to 74 × 10
4 CFU/mL. The
physico-chemical parameters were analysed and showed less amount compared to
untreated water samples (Table 4). Due to presence of bacterial biomass, the amount
of total solids (2880 mg/L) and turbidity (25 NTU) were found to be higher in water
sample before sand filtration (Table 4). The values of treated water after sand filtration
were with in the permissible limits of drinking water standards.
Autotrophic denitrification was attained from potable water by Thiobacillusdenitrificans using three laboratory-scale column reactors under three hydraulic retention
times (Darbi et al. 2003). Dhamole et al. (2009) studied simultaneous removal of
carbon and NO 3
− from synthetic water using an airlift bioreactor. Similarly, laboratory and pilot scale set up was developed for NO 3
− removal from drinking water
containing 100 mg/L of NO 3
− with the bacterial consortium of KW1 and YW4 and
99.4% and 92% of NO 3
− was removed at 48 h. However, in pilot scale treatment
the percentage of NO 3
− removal was slightly lesser when compared to laboratory
study. This might be due to some natural environmental factors that interfere in the
bacterial growth and NO 3
− utilization.
After treatment, the bacterial population was 74 × 10
4 CFU/mL and an attempt
was made to remove the microorganisms using chemical coagulants (alum and lime).
The coagulants after reduced the bacterial biomass by quicker precipitation. The
population in the water was reduced to 16 × 10
1 CFU/mL. Ayyasamy et al. (2007)
used different coagulating agents such as alum, lime and PAC and found that significant levels of microbial biomass removal through precipitation process. Dziubek
0
10
20
30
40
50
60
70
80
90
100
0
6
12
18
24
30
36
42
48
Concentration
Time (h)
Nitrate (mg/L)
Bacteria (X10e+4 CFU m/L)
Nitrite (mg/L)
Ammonium (mg/L)
Fig. 6 Effect of pilot scale study of nitrate removal on parameters