

298
C. R. P. Vasconcelos et al.
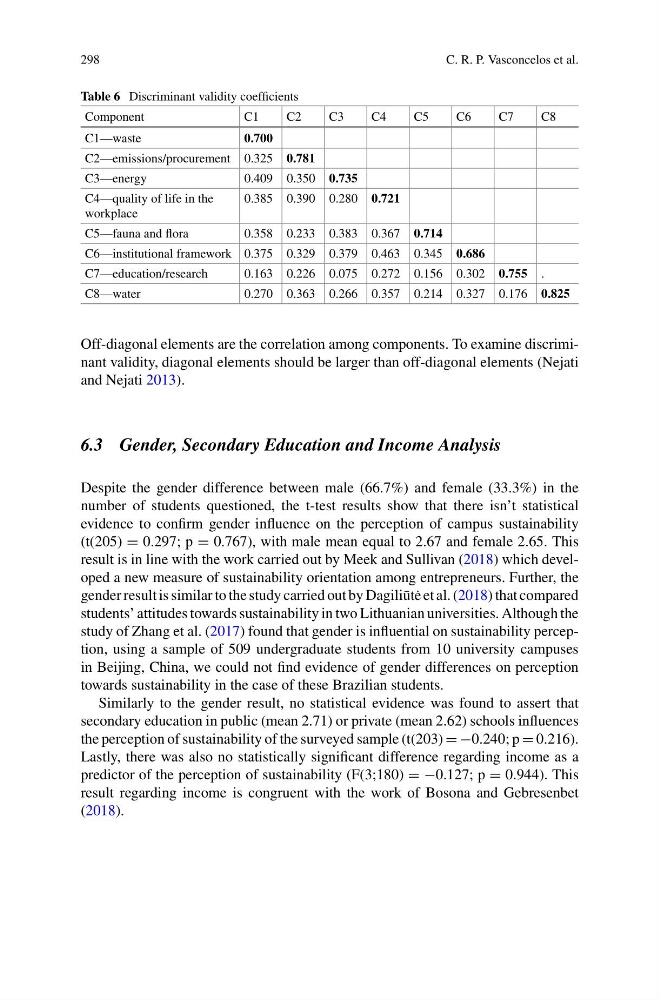
Table 6 Discriminant validity coefficients
Component
C1
C2
C3
C4
C5
C6
C7
C8
C1—waste
0.700
C2—emissions/procurement 0.325 0.781
C3—energy
0.409 0.350 0.735
C4—quality of life in the
workplace
0.385 0.390 0.280 0.721
C5—fauna and flora
0.358 0.233 0.383 0.367 0.714
C6—institutional framework 0.375 0.329 0.379 0.463 0.345 0.686
C7—education/research
0.163 0.226 0.075 0.272 0.156 0.302 0.755 .
C8—water
0.270 0.363 0.266 0.357 0.214 0.327 0.176 0.825
Off-diagonal elements are the correlation among components. To examine discriminant validity, diagonal elements should be larger than off-diagonal elements (Nejati
and Nejati 2013).
6.3 Gender, Secondary Education and Income Analysis
Despite the gender difference between male (66.7%) and female (33.3%) in the
number of students questioned, the t-test results show that there isn’t statistical
evidence to confirm gender influence on the perception of campus sustainability
(t(205) = 0.297; p = 0.767), with male mean equal to 2.67 and female 2.65. This
result is in line with the work carried out by Meek and Sullivan (2018) which developed a new measure of sustainability orientation among entrepreneurs. Further, the
gender result is similar to the study carried out by Dagili¯ ut˙ e et al. (2018) that compared
students’ attitudes towards sustainability in two Lithuanian universities. Although the
study of Zhang et al. (2017) found that gender is influential on sustainability perception, using a sample of 509 undergraduate students from 10 university campuses
in Beijing, China, we could not find evidence of gender differences on perception
towards sustainability in the case of these Brazilian students.
Similarly to the gender result, no statistical evidence was found to assert that
secondary education in public (mean 2.71) or private (mean 2.62) schools influences
the perception of sustainability of the surveyed sample (t(203) = −0.240; p = 0.216).
Lastly, there was also no statistically significant difference regarding income as a
predictor of the perception of sustainability (F(3;180) = −0.127; p = 0.944). This
result regarding income is congruent with the work of Bosona and Gebresenbet
(2018).
C. R. P. Vasconcelos et al.
Table 6 Discriminant validity coefficients
Component
C1
C2
C3
C4
C5
C6
C7
C8
C1—waste
0.700
C2—emissions/procurement 0.325 0.781
C3—energy
0.409 0.350 0.735
C4—quality of life in the
workplace
0.385 0.390 0.280 0.721
C5—fauna and flora
0.358 0.233 0.383 0.367 0.714
C6—institutional framework 0.375 0.329 0.379 0.463 0.345 0.686
C7—education/research
0.163 0.226 0.075 0.272 0.156 0.302 0.755 .
C8—water
0.270 0.363 0.266 0.357 0.214 0.327 0.176 0.825
Off-diagonal elements are the correlation among components. To examine discriminant validity, diagonal elements should be larger than off-diagonal elements (Nejati
and Nejati 2013).
6.3 Gender, Secondary Education and Income Analysis
Despite the gender difference between male (66.7%) and female (33.3%) in the
number of students questioned, the t-test results show that there isn’t statistical
evidence to confirm gender influence on the perception of campus sustainability
(t(205) = 0.297; p = 0.767), with male mean equal to 2.67 and female 2.65. This
result is in line with the work carried out by Meek and Sullivan (2018) which developed a new measure of sustainability orientation among entrepreneurs. Further, the
gender result is similar to the study carried out by Dagili¯ ut˙ e et al. (2018) that compared
students’ attitudes towards sustainability in two Lithuanian universities. Although the
study of Zhang et al. (2017) found that gender is influential on sustainability perception, using a sample of 509 undergraduate students from 10 university campuses
in Beijing, China, we could not find evidence of gender differences on perception
towards sustainability in the case of these Brazilian students.
Similarly to the gender result, no statistical evidence was found to assert that
secondary education in public (mean 2.71) or private (mean 2.62) schools influences
the perception of sustainability of the surveyed sample (t(203) = −0.240; p = 0.216).
Lastly, there was also no statistically significant difference regarding income as a
predictor of the perception of sustainability (F(3;180) = −0.127; p = 0.944). This
result regarding income is congruent with the work of Bosona and Gebresenbet
(2018).