

Students’ Perception of Campus Sustainability …
295
Table 4 Rotated component loading matrix (VARIMAX)
C1
C2
C3
C4
C5
C6
C7
C8
Sum of squares
(eigenvalues)
3.776
3.060
2.776
2.721
2.675
2.445
2.015
1.779
% of trace
12.149
9.871
8.954
8.777
8.628
7.887
6.500
5.738
Cumulative %
of trace
12.149 22.020 30.973 39.751 48.379 56.266 62.766 68.504
difference across components less than 0.10 were suppressed. Applying the criteria
described above, 11 items were removed from the model.
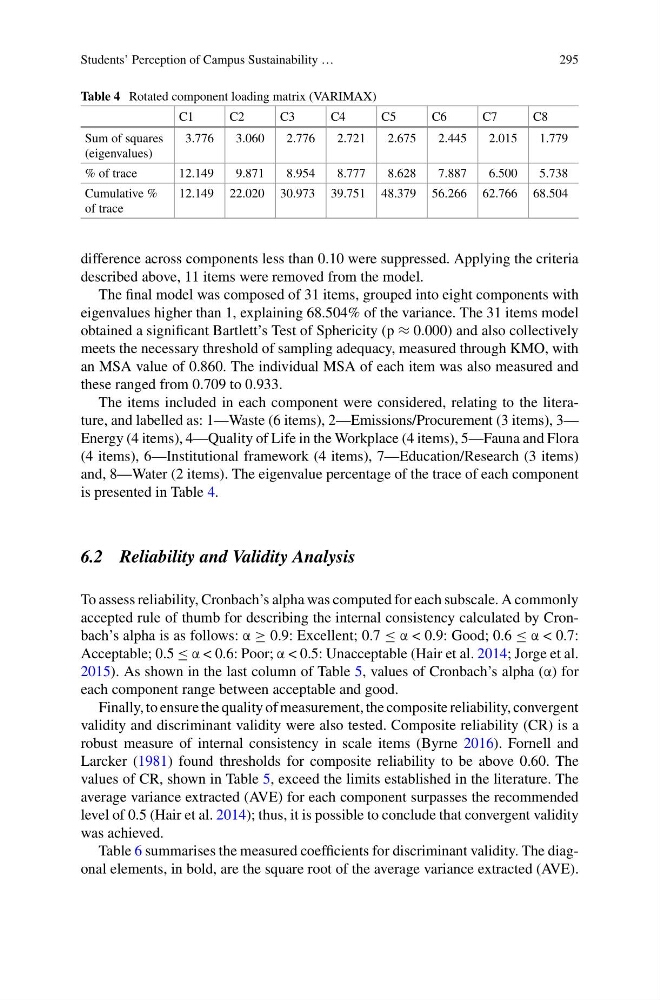
The final model was composed of 31 items, grouped into eight components with
eigenvalues higher than 1, explaining 68.504% of the variance. The 31 items model
obtained a significant Bartlett’s Test of Sphericity (p ≈ 0.000) and also collectively
meets the necessary threshold of sampling adequacy, measured through KMO, with
an MSA value of 0.860. The individual MSA of each item was also measured and
these ranged from 0.709 to 0.933.
The items included in each component were considered, relating to the literature, and labelled as: 1—Waste (6 items), 2—Emissions/Procurement (3 items), 3—
Energy (4 items), 4—Quality of Life in the Workplace (4 items), 5—Fauna and Flora
(4 items), 6—Institutional framework (4 items), 7—Education/Research (3 items)
and, 8—Water (2 items). The eigenvalue percentage of the trace of each component
is presented in Table 4.
6.2 Reliability and Validity Analysis
To assess reliability, Cronbach’s alpha was computed for each subscale. A commonly
accepted rule of thumb for describing the internal consistency calculated by Cronbach’s alpha is as follows: α ≥ 0.9: Excellent; 0.7 ≤ α < 0.9: Good; 0.6 ≤ α < 0.7:
Acceptable; 0.5 ≤ α < 0.6: Poor; α < 0.5: Unacceptable (Hair et al. 2014; Jorge et al.
2015). As shown in the last column of Table 5, values of Cronbach’s alpha (α) for
each component range between acceptable and good.
Finally, to ensure the quality of measurement, the composite reliability, convergent
validity and discriminant validity were also tested. Composite reliability (CR) is a
robust measure of internal consistency in scale items (Byrne 2016). Fornell and
Larcker (1981) found thresholds for composite reliability to be above 0.60. The
values of CR, shown in Table 5, exceed the limits established in the literature. The
average variance extracted (AVE) for each component surpasses the recommended
level of 0.5 (Hair et al. 2014); thus, it is possible to conclude that convergent validity
was achieved.
Table 6 summarises the measured coefficients for discriminant validity. The diagonal elements, in bold, are the square root of the average variance extracted (AVE).
295
Table 4 Rotated component loading matrix (VARIMAX)
C1
C2
C3
C4
C5
C6
C7
C8
Sum of squares
(eigenvalues)
3.776
3.060
2.776
2.721
2.675
2.445
2.015
1.779
% of trace
12.149
9.871
8.954
8.777
8.628
7.887
6.500
5.738
Cumulative %
of trace
12.149 22.020 30.973 39.751 48.379 56.266 62.766 68.504
difference across components less than 0.10 were suppressed. Applying the criteria
described above, 11 items were removed from the model.
The final model was composed of 31 items, grouped into eight components with
eigenvalues higher than 1, explaining 68.504% of the variance. The 31 items model
obtained a significant Bartlett’s Test of Sphericity (p ≈ 0.000) and also collectively
meets the necessary threshold of sampling adequacy, measured through KMO, with
an MSA value of 0.860. The individual MSA of each item was also measured and
these ranged from 0.709 to 0.933.
The items included in each component were considered, relating to the literature, and labelled as: 1—Waste (6 items), 2—Emissions/Procurement (3 items), 3—
Energy (4 items), 4—Quality of Life in the Workplace (4 items), 5—Fauna and Flora
(4 items), 6—Institutional framework (4 items), 7—Education/Research (3 items)
and, 8—Water (2 items). The eigenvalue percentage of the trace of each component
is presented in Table 4.
6.2 Reliability and Validity Analysis
To assess reliability, Cronbach’s alpha was computed for each subscale. A commonly
accepted rule of thumb for describing the internal consistency calculated by Cronbach’s alpha is as follows: α ≥ 0.9: Excellent; 0.7 ≤ α < 0.9: Good; 0.6 ≤ α < 0.7:
Acceptable; 0.5 ≤ α < 0.6: Poor; α < 0.5: Unacceptable (Hair et al. 2014; Jorge et al.
2015). As shown in the last column of Table 5, values of Cronbach’s alpha (α) for
each component range between acceptable and good.
Finally, to ensure the quality of measurement, the composite reliability, convergent
validity and discriminant validity were also tested. Composite reliability (CR) is a
robust measure of internal consistency in scale items (Byrne 2016). Fornell and
Larcker (1981) found thresholds for composite reliability to be above 0.60. The
values of CR, shown in Table 5, exceed the limits established in the literature. The
average variance extracted (AVE) for each component surpasses the recommended
level of 0.5 (Hair et al. 2014); thus, it is possible to conclude that convergent validity
was achieved.
Table 6 summarises the measured coefficients for discriminant validity. The diagonal elements, in bold, are the square root of the average variance extracted (AVE).