

294
C. R. P. Vasconcelos et al.
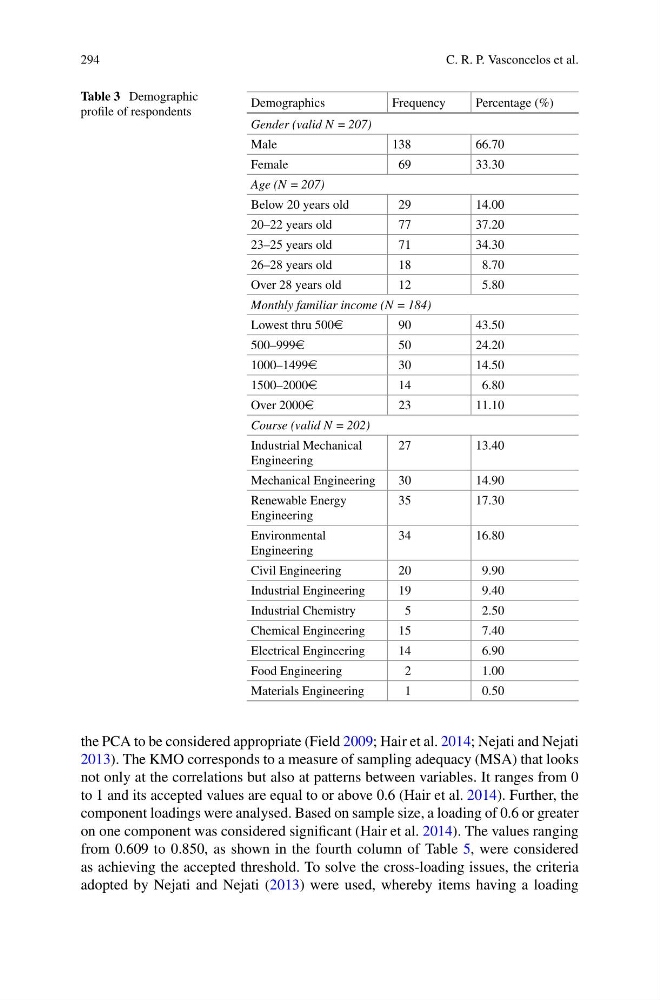
Table 3 Demographic
profile of respondents
Demographics
Frequency
Percentage (%)
Gender (valid N = 207)
Male
138
66.70
Female
69
33.30
Age (N = 207)
Below 20 years old
29
14.00
20–22 years old
77
37.20
23–25 years old
71
34.30
26–28 years old
18
8.70
Over 28 years old
12
5.80
Monthly familiar income (N = 184)
Lowest thru 500e
90
43.50
500–999e
50
24.20
1000–1499e
30
14.50
1500–2000e
14
6.80
Over 2000e
23
11.10
Course (valid N = 202)
Industrial Mechanical
Engineering
27
13.40
Mechanical Engineering
30
14.90
Renewable Energy
Engineering
35
17.30
Environmental
Engineering
34
16.80
Civil Engineering
20
9.90
Industrial Engineering
19
9.40
Industrial Chemistry
5
2.50
Chemical Engineering
15
7.40
Electrical Engineering
14
6.90
Food Engineering
2
1.00
Materials Engineering
1
0.50
the PCA to be considered appropriate (Field 2009; Hair et al. 2014; Nejati and Nejati
2013). The KMO corresponds to a measure of sampling adequacy (MSA) that looks
not only at the correlations but also at patterns between variables. It ranges from 0
to 1 and its accepted values are equal to or above 0.6 (Hair et al. 2014). Further, the
component loadings were analysed. Based on sample size, a loading of 0.6 or greater
on one component was considered significant (Hair et al. 2014). The values ranging
from 0.609 to 0.850, as shown in the fourth column of Table 5, were considered
as achieving the accepted threshold. To solve the cross-loading issues, the criteria
adopted by Nejati and Nejati (2013) were used, whereby items having a loading
C. R. P. Vasconcelos et al.
Table 3 Demographic
profile of respondents
Demographics
Frequency
Percentage (%)
Gender (valid N = 207)
Male
138
66.70
Female
69
33.30
Age (N = 207)
Below 20 years old
29
14.00
20–22 years old
77
37.20
23–25 years old
71
34.30
26–28 years old
18
8.70
Over 28 years old
12
5.80
Monthly familiar income (N = 184)
Lowest thru 500e
90
43.50
500–999e
50
24.20
1000–1499e
30
14.50
1500–2000e
14
6.80
Over 2000e
23
11.10
Course (valid N = 202)
Industrial Mechanical
Engineering
27
13.40
Mechanical Engineering
30
14.90
Renewable Energy
Engineering
35
17.30
Environmental
Engineering
34
16.80
Civil Engineering
20
9.90
Industrial Engineering
19
9.40
Industrial Chemistry
5
2.50
Chemical Engineering
15
7.40
Electrical Engineering
14
6.90
Food Engineering
2
1.00
Materials Engineering
1
0.50
the PCA to be considered appropriate (Field 2009; Hair et al. 2014; Nejati and Nejati
2013). The KMO corresponds to a measure of sampling adequacy (MSA) that looks
not only at the correlations but also at patterns between variables. It ranges from 0
to 1 and its accepted values are equal to or above 0.6 (Hair et al. 2014). Further, the
component loadings were analysed. Based on sample size, a loading of 0.6 or greater
on one component was considered significant (Hair et al. 2014). The values ranging
from 0.609 to 0.850, as shown in the fourth column of Table 5, were considered
as achieving the accepted threshold. To solve the cross-loading issues, the criteria
adopted by Nejati and Nejati (2013) were used, whereby items having a loading