

368
not appear to undergo any charge transfer reaction, as the Pb signal with argon gas
in the cell remained at practically the same level as with no reaction gas. Very good
sensitivity was obtained for
206
Pb,
207
Pb and
208
Pb isotope concentration measurements (Fig. 12.2). Satisfactory linearity (R) was obtained in the range from 5
to100 μg/L (Fig. 12.2). The instrumental detection limits for the three isotopes
(
206
Pb,
207
Pb and
208
Pb) were calculated as 0.35, 2.86 and 0.85 μg/L, respectively.
12.5.2 Model Testing and Implementation
The samples were prepared according to a validated procedure for multi-element
chemical analysis. ICP-MS optimization was performed using a standard tuning
solution (containing 1 μg/L each of Li, Mg, Y, Ce, Tl and Co in a 2% HNO 3 matrix).
The multi- element analysis included quantification of the isotopes and is given in
Table 12.1. Special emphasis has been given to the lead content in the goji berry
samples (Table 12.2). Comparative analysis has been applied between the two
groups of samples (geographical regions), where the significant difference has been
evaluated for the total Pb content in samples. The same occurrence has been evident
when the isotope ratios were calculated (Table 12.3, Fig. 12.3).
12.5.3 Metrics Tools
Multi-element analysis covered the characterization of more than 30 elements, as
given in Table 12.1. Comparative analysis for each individual element could not
provide unified information. As multi-elemental analysis involves the analysis of
essential nutrients, nutrients and trace elements, its content in the samples may vary
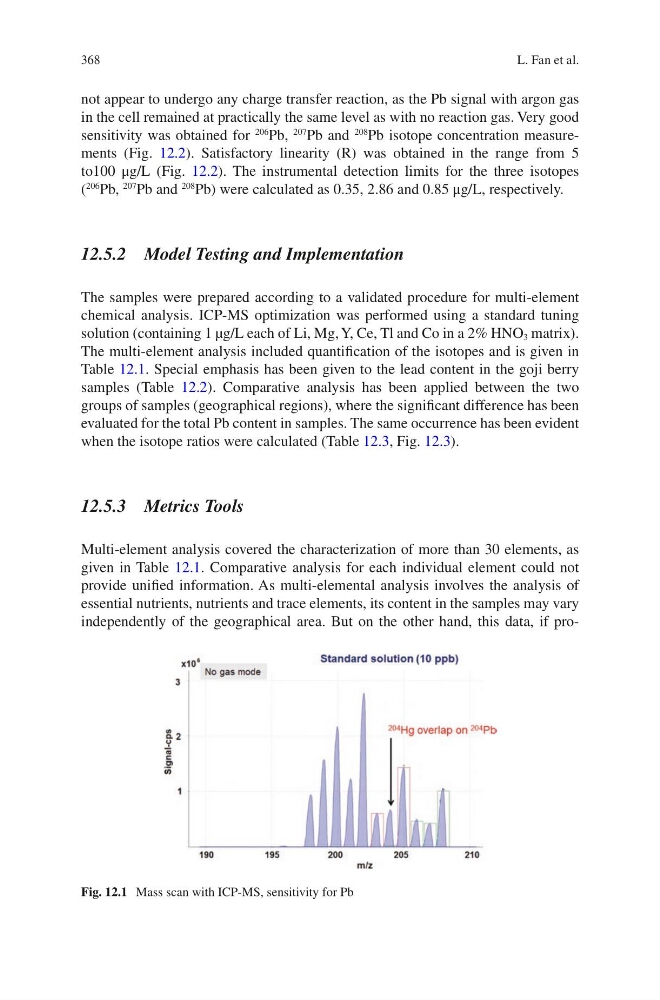
independently of the geographical area. But on the other hand, this data, if proFig. 12.1 Mass scan with ICP-MS, sensitivity for Pb
L. Fan et al.
not appear to undergo any charge transfer reaction, as the Pb signal with argon gas
in the cell remained at practically the same level as with no reaction gas. Very good
sensitivity was obtained for
206
Pb,
207
Pb and
208
Pb isotope concentration measurements (Fig. 12.2). Satisfactory linearity (R) was obtained in the range from 5
to100 μg/L (Fig. 12.2). The instrumental detection limits for the three isotopes
(
206
Pb,
207
Pb and
208
Pb) were calculated as 0.35, 2.86 and 0.85 μg/L, respectively.
12.5.2 Model Testing and Implementation
The samples were prepared according to a validated procedure for multi-element
chemical analysis. ICP-MS optimization was performed using a standard tuning
solution (containing 1 μg/L each of Li, Mg, Y, Ce, Tl and Co in a 2% HNO 3 matrix).
The multi- element analysis included quantification of the isotopes and is given in
Table 12.1. Special emphasis has been given to the lead content in the goji berry
samples (Table 12.2). Comparative analysis has been applied between the two
groups of samples (geographical regions), where the significant difference has been
evaluated for the total Pb content in samples. The same occurrence has been evident
when the isotope ratios were calculated (Table 12.3, Fig. 12.3).
12.5.3 Metrics Tools
Multi-element analysis covered the characterization of more than 30 elements, as
given in Table 12.1. Comparative analysis for each individual element could not
provide unified information. As multi-elemental analysis involves the analysis of
essential nutrients, nutrients and trace elements, its content in the samples may vary
independently of the geographical area. But on the other hand, this data, if proFig. 12.1 Mass scan with ICP-MS, sensitivity for Pb
L. Fan et al.