

302
to Mohammadi and Prasanna (2003), most frequently used approaches are principal
component analysis and cluster analysis, which are used for estimation of genetic
diversity in various crops such as wheat (Hailu et al. 2006), sorghum (Ayana and
Becele 1999), corn (Kamara et al. 2003), sunflower (Kholghi et al. 2011; Markova
Ruzdik et al. 2015), and barley (Žàkovà and Benkovà 2006; Markova Ruzdik et al.
2016). PCA has been widely used in plant science, and the objective of this analysis
is reduction of dimensionality of a data set with a large number of correlated variables of traits (Jolliffe 2002).
In this study, principal component analysis was utilized to examine the variation
and to estimate the relative contribution of tested elements for total variability.
Principal component analysis was carried out by using 30 barley winter genotypes
and 10 elements. Two main components were extracted with Eigen value greater
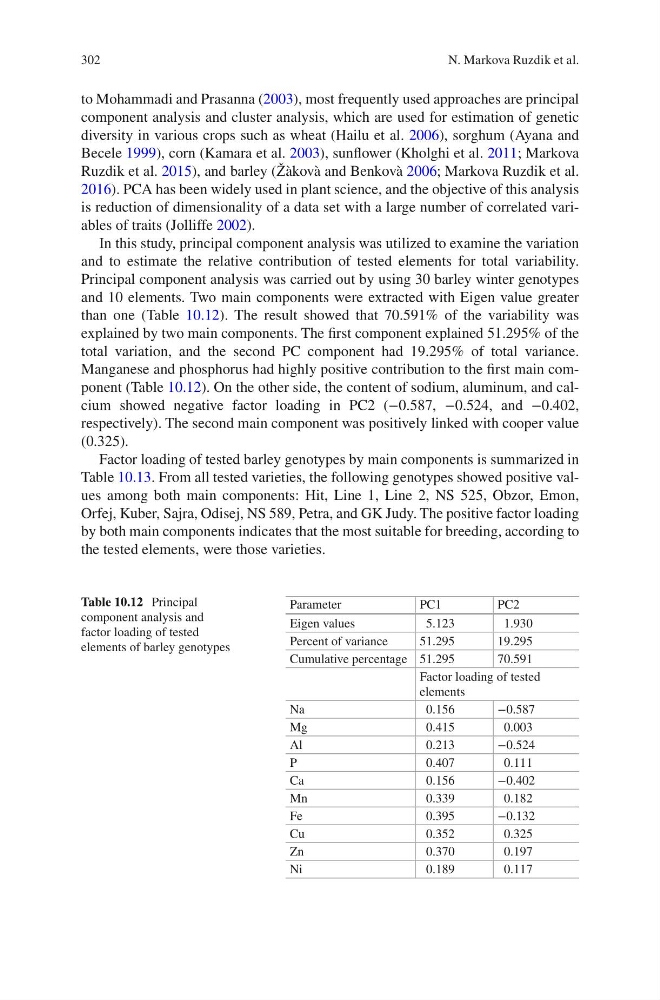
than one (Table 10.12). The result showed that 70.591% of the variability was
explained by two main components. The first component explained 51.295% of the
total variation, and the second PC component had 19.295% of total variance.
Manganese and phosphorus had highly positive contribution to the first main component (Table 10.12). On the other side, the content of sodium, aluminum, and calcium showed negative factor loading in PC2 (−0.587, −0.524, and −0.402,
respectively). The second main component was positively linked with cooper value
(0.325).
Factor loading of tested barley genotypes by main components is summarized in
Table 10.13. From all tested varieties, the following genotypes showed positive values among both main components: Hit, Line 1, Line 2, NS 525, Obzor, Emon,
Orfej, Kuber, Sajra, Odisej, NS 589, Petra, and GK Judy. The positive factor loading
by both main components indicates that the most suitable for breeding, according to
the tested elements, were those varieties.
Table 10.12 Principal
component analysis and
factor loading of tested
elements of barley genotypes
Parameter
PC1
PC2
Eigen values
5.123
1.930
Percent of variance
51.295
19.295
Cumulative percentage 51.295
70.591
Factor loading of tested
elements
Na
0.156
−0.587
Mg
0.415
0.003
Al
0.213
−0.524
P
0.407
0.111
Ca
0.156
−0.402
Mn
0.339
0.182
Fe
0.395
−0.132
Cu
0.352
0.325
Zn
0.370
0.197
Ni
0.189
0.117
N. Markova Ruzdik et al.
to Mohammadi and Prasanna (2003), most frequently used approaches are principal
component analysis and cluster analysis, which are used for estimation of genetic
diversity in various crops such as wheat (Hailu et al. 2006), sorghum (Ayana and
Becele 1999), corn (Kamara et al. 2003), sunflower (Kholghi et al. 2011; Markova
Ruzdik et al. 2015), and barley (Žàkovà and Benkovà 2006; Markova Ruzdik et al.
2016). PCA has been widely used in plant science, and the objective of this analysis
is reduction of dimensionality of a data set with a large number of correlated variables of traits (Jolliffe 2002).
In this study, principal component analysis was utilized to examine the variation
and to estimate the relative contribution of tested elements for total variability.
Principal component analysis was carried out by using 30 barley winter genotypes
and 10 elements. Two main components were extracted with Eigen value greater
than one (Table 10.12). The result showed that 70.591% of the variability was
explained by two main components. The first component explained 51.295% of the
total variation, and the second PC component had 19.295% of total variance.
Manganese and phosphorus had highly positive contribution to the first main component (Table 10.12). On the other side, the content of sodium, aluminum, and calcium showed negative factor loading in PC2 (−0.587, −0.524, and −0.402,
respectively). The second main component was positively linked with cooper value
(0.325).
Factor loading of tested barley genotypes by main components is summarized in
Table 10.13. From all tested varieties, the following genotypes showed positive values among both main components: Hit, Line 1, Line 2, NS 525, Obzor, Emon,
Orfej, Kuber, Sajra, Odisej, NS 589, Petra, and GK Judy. The positive factor loading
by both main components indicates that the most suitable for breeding, according to
the tested elements, were those varieties.
Table 10.12 Principal
component analysis and
factor loading of tested
elements of barley genotypes
Parameter
PC1
PC2
Eigen values
5.123
1.930
Percent of variance
51.295
19.295
Cumulative percentage 51.295
70.591
Factor loading of tested
elements
Na
0.156
−0.587
Mg
0.415
0.003
Al
0.213
−0.524
P
0.407
0.111
Ca
0.156
−0.402
Mn
0.339
0.182
Fe
0.395
−0.132
Cu
0.352
0.325
Zn
0.370
0.197
Ni
0.189
0.117
N. Markova Ruzdik et al.