

301
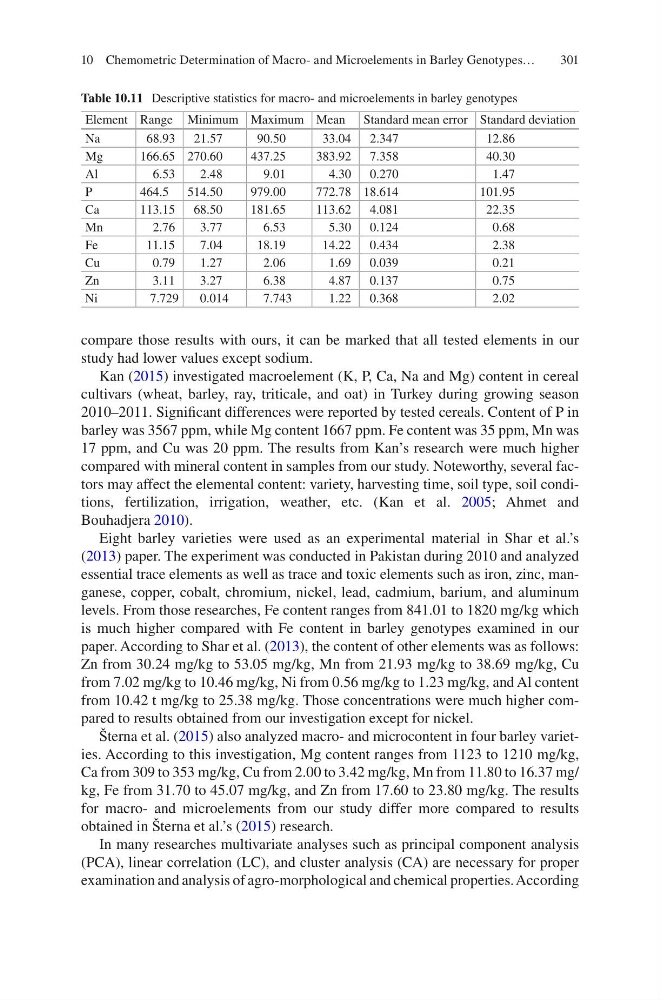
compare those results with ours, it can be marked that all tested elements in our
study had lower values except sodium.
Kan (2015) investigated macroelement (K, P, Ca, Na and Mg) content in cereal
cultivars (wheat, barley, ray, triticale, and oat) in Turkey during growing season
2010–2011. Significant differences were reported by tested cereals. Content of P in
barley was 3567 ppm, while Mg content 1667 ppm. Fe content was 35 ppm, Mn was
17 ppm, and Cu was 20 ppm. The results from Kan’s research were much higher
compared with mineral content in samples from our study. Noteworthy, several factors may affect the elemental content: variety, harvesting time, soil type, soil conditions, fertilization, irrigation, weather, etc. (Kan et al. 2005; Ahmet and
Bouhadjera 2010).
Eight barley varieties were used as an experimental material in Shar et al.’s
(2013) paper. The experiment was conducted in Pakistan during 2010 and analyzed
essential trace elements as well as trace and toxic elements such as iron, zinc, manganese, copper, cobalt, chromium, nickel, lead, cadmium, barium, and aluminum
levels. From those researches, Fe content ranges from 841.01 to 1820 mg/kg which
is much higher compared with Fe content in barley genotypes examined in our
paper. According to Shar et al. (2013), the content of other elements was as follows:
Zn from 30.24 mg/kg to 53.05 mg/kg, Mn from 21.93 mg/kg to 38.69 mg/kg, Cu
from 7.02 mg/kg to 10.46 mg/kg, Ni from 0.56 mg/kg to 1.23 mg/kg, and Al content
from 10.42 t mg/kg to 25.38 mg/kg. Those concentrations were much higher compared to results obtained from our investigation except for nickel.
Šterna et al. (2015) also analyzed macro- and microcontent in four barley varieties. According to this investigation, Mg content ranges from 1123 to 1210 mg/kg,
Ca from 309 to 353 mg/kg, Cu from 2.00 to 3.42 mg/kg, Mn from 11.80 to 16.37 mg/
kg, Fe from 31.70 to 45.07 mg/kg, and Zn from 17.60 to 23.80 mg/kg. The results
for macro- and microelements from our study differ more compared to results
obtained in Šterna et al.’s (2015) research.
In many researches multivariate analyses such as principal component analysis
(PCA), linear correlation (LC), and cluster analysis (CA) are necessary for proper
examination and analysis of agro-morphological and chemical properties. According
Table 10.11 Descriptive statistics for macro- and microelements in barley genotypes
Element Range Minimum Maximum Mean Standard mean error Standard deviation
Na
68.93 21.57
90.50
33.04 2.347
12.86
Mg
166.65 270.60
437.25
383.92 7.358
40.30
Al
6.53
2.48
9.01
4.30 0.270
1.47
P
464.5 514.50
979.00
772.78 18.614
101.95
Ca
113.15 68.50
181.65
113.62 4.081
22.35
Mn
2.76
3.77
6.53
5.30 0.124
0.68
Fe
11.15
7.04
18.19
14.22 0.434
2.38
Cu
0.79
1.27
2.06
1.69 0.039
0.21
Zn
3.11
3.27
6.38
4.87 0.137
0.75
Ni
7.729
0.014
7.743
1.22 0.368
2.02
10 Chemometric Determination of Macro- and Microelements in Barley Genotypes…
compare those results with ours, it can be marked that all tested elements in our
study had lower values except sodium.
Kan (2015) investigated macroelement (K, P, Ca, Na and Mg) content in cereal
cultivars (wheat, barley, ray, triticale, and oat) in Turkey during growing season
2010–2011. Significant differences were reported by tested cereals. Content of P in
barley was 3567 ppm, while Mg content 1667 ppm. Fe content was 35 ppm, Mn was
17 ppm, and Cu was 20 ppm. The results from Kan’s research were much higher
compared with mineral content in samples from our study. Noteworthy, several factors may affect the elemental content: variety, harvesting time, soil type, soil conditions, fertilization, irrigation, weather, etc. (Kan et al. 2005; Ahmet and
Bouhadjera 2010).
Eight barley varieties were used as an experimental material in Shar et al.’s
(2013) paper. The experiment was conducted in Pakistan during 2010 and analyzed
essential trace elements as well as trace and toxic elements such as iron, zinc, manganese, copper, cobalt, chromium, nickel, lead, cadmium, barium, and aluminum
levels. From those researches, Fe content ranges from 841.01 to 1820 mg/kg which
is much higher compared with Fe content in barley genotypes examined in our
paper. According to Shar et al. (2013), the content of other elements was as follows:
Zn from 30.24 mg/kg to 53.05 mg/kg, Mn from 21.93 mg/kg to 38.69 mg/kg, Cu
from 7.02 mg/kg to 10.46 mg/kg, Ni from 0.56 mg/kg to 1.23 mg/kg, and Al content
from 10.42 t mg/kg to 25.38 mg/kg. Those concentrations were much higher compared to results obtained from our investigation except for nickel.
Šterna et al. (2015) also analyzed macro- and microcontent in four barley varieties. According to this investigation, Mg content ranges from 1123 to 1210 mg/kg,
Ca from 309 to 353 mg/kg, Cu from 2.00 to 3.42 mg/kg, Mn from 11.80 to 16.37 mg/
kg, Fe from 31.70 to 45.07 mg/kg, and Zn from 17.60 to 23.80 mg/kg. The results
for macro- and microelements from our study differ more compared to results
obtained in Šterna et al.’s (2015) research.
In many researches multivariate analyses such as principal component analysis
(PCA), linear correlation (LC), and cluster analysis (CA) are necessary for proper
examination and analysis of agro-morphological and chemical properties. According
Table 10.11 Descriptive statistics for macro- and microelements in barley genotypes
Element Range Minimum Maximum Mean Standard mean error Standard deviation
Na
68.93 21.57
90.50
33.04 2.347
12.86
Mg
166.65 270.60
437.25
383.92 7.358
40.30
Al
6.53
2.48
9.01
4.30 0.270
1.47
P
464.5 514.50
979.00
772.78 18.614
101.95
Ca
113.15 68.50
181.65
113.62 4.081
22.35
Mn
2.76
3.77
6.53
5.30 0.124
0.68
Fe
11.15
7.04
18.19
14.22 0.434
2.38
Cu
0.79
1.27
2.06
1.69 0.039
0.21
Zn
3.11
3.27
6.38
4.87 0.137
0.75
Ni
7.729
0.014
7.743
1.22 0.368
2.02
10 Chemometric Determination of Macro- and Microelements in Barley Genotypes…