

269
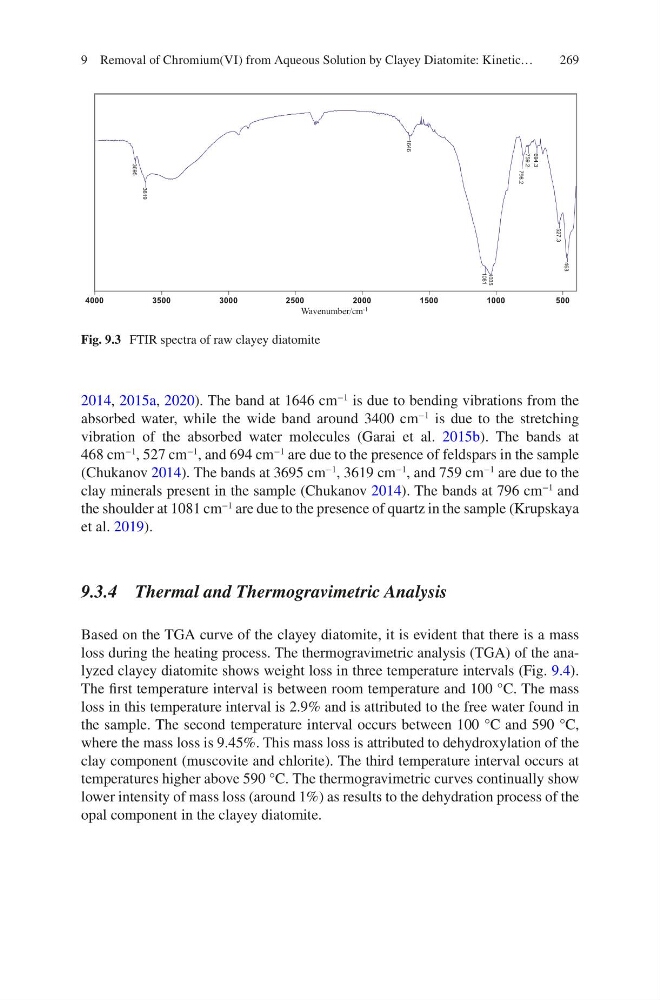
2014, 2015a, 2020). The band at 1646 cm
−1
is due to bending vibrations from the
absorbed water, while the wide band around 3400 cm
−1
is due to the stretching
vibration of the absorbed water molecules (Garai et al. 2015b). The bands at
468 cm
−1
, 527 cm
−1
, and 694 cm
−1
are due to the presence of feldspars in the sample
(Chukanov 2014). The bands at 3695 cm
−1
, 3619 cm
−1
, and 759 cm
−1
are due to the
clay minerals present in the sample (Chukanov 2014). The bands at 796 cm
−1
and
the shoulder at 1081 cm
−1
are due to the presence of quartz in the sample (Krupskaya
et al. 2019).
9.3.4 Thermal and Thermogravimetric Analysis
Based on the TGA curve of the clayey diatomite, it is evident that there is a mass
loss during the heating process. The thermogravimetric analysis (TGA) of the analyzed clayey diatomite shows weight loss in three temperature intervals (Fig. 9.4).
The first temperature interval is between room temperature and 100 °C. The mass
loss in this temperature interval is 2.9% and is attributed to the free water found in
the sample. The second temperature interval occurs between 100 °C and 590 °C,
where the mass loss is 9.45%. This mass loss is attributed to dehydroxylation of the
clay component (muscovite and chlorite). The third temperature interval occurs at
temperatures higher above 590 °C. The thermogravimetric curves continually show
lower intensity of mass loss (around 1%) as results to the dehydration process of the
opal component in the clayey diatomite.
3695
3619
1646
1081
1035
796.2
759.2
694.3
527.3
468
4000
3500
3000
2500
2000
1500
1000
500
Wavenumber/cm -1
Fig. 9.3 FTIR spectra of raw clayey diatomite
9 Removal of Chromium(VI) from Aqueous Solution by Clayey Diatomite: Kinetic…
2014, 2015a, 2020). The band at 1646 cm
−1
is due to bending vibrations from the
absorbed water, while the wide band around 3400 cm
−1
is due to the stretching
vibration of the absorbed water molecules (Garai et al. 2015b). The bands at
468 cm
−1
, 527 cm
−1
, and 694 cm
−1
are due to the presence of feldspars in the sample
(Chukanov 2014). The bands at 3695 cm
−1
, 3619 cm
−1
, and 759 cm
−1
are due to the
clay minerals present in the sample (Chukanov 2014). The bands at 796 cm
−1
and
the shoulder at 1081 cm
−1
are due to the presence of quartz in the sample (Krupskaya
et al. 2019).
9.3.4 Thermal and Thermogravimetric Analysis
Based on the TGA curve of the clayey diatomite, it is evident that there is a mass
loss during the heating process. The thermogravimetric analysis (TGA) of the analyzed clayey diatomite shows weight loss in three temperature intervals (Fig. 9.4).
The first temperature interval is between room temperature and 100 °C. The mass
loss in this temperature interval is 2.9% and is attributed to the free water found in
the sample. The second temperature interval occurs between 100 °C and 590 °C,
where the mass loss is 9.45%. This mass loss is attributed to dehydroxylation of the
clay component (muscovite and chlorite). The third temperature interval occurs at
temperatures higher above 590 °C. The thermogravimetric curves continually show
lower intensity of mass loss (around 1%) as results to the dehydration process of the
opal component in the clayey diatomite.
3695
3619
1646
1081
1035
796.2
759.2
694.3
527.3
468
4000
3500
3000
2500
2000
1500
1000
500
Wavenumber/cm -1
Fig. 9.3 FTIR spectra of raw clayey diatomite
9 Removal of Chromium(VI) from Aqueous Solution by Clayey Diatomite: Kinetic…