

89
To construct the maps for the distribution of the elements as well as for the factor
associations, the universal kriging method was applied. Kriging is an optimal prediction method, indented for geophysical variables with continuous data distribution. The obtained values of variables can sometimes be random, but their variance
is not described with geometric function. This method performs projection of an
object by using the values of certain parameters that describe its position (latitude,
longitude and oval height), i.e. any object can be spatially defined. All data about
variables are organised in several possible ways; most common one used is raster.
Generally, raster consists of a matrix of cells (pixels) arranged in rows and columns,
where each cell contains values that provide information about variables. Digital air
photography, satellite imagery, digital images and scanned maps can be used as a
raster. Kriging interpolation performs the output of each raster cell by calculating
the average load of nearby vectors. Kriging method analyses the statistical variation
of the values of different distances and at various positions and determines the shape
and size of the specified point for examination as a set of load factors.
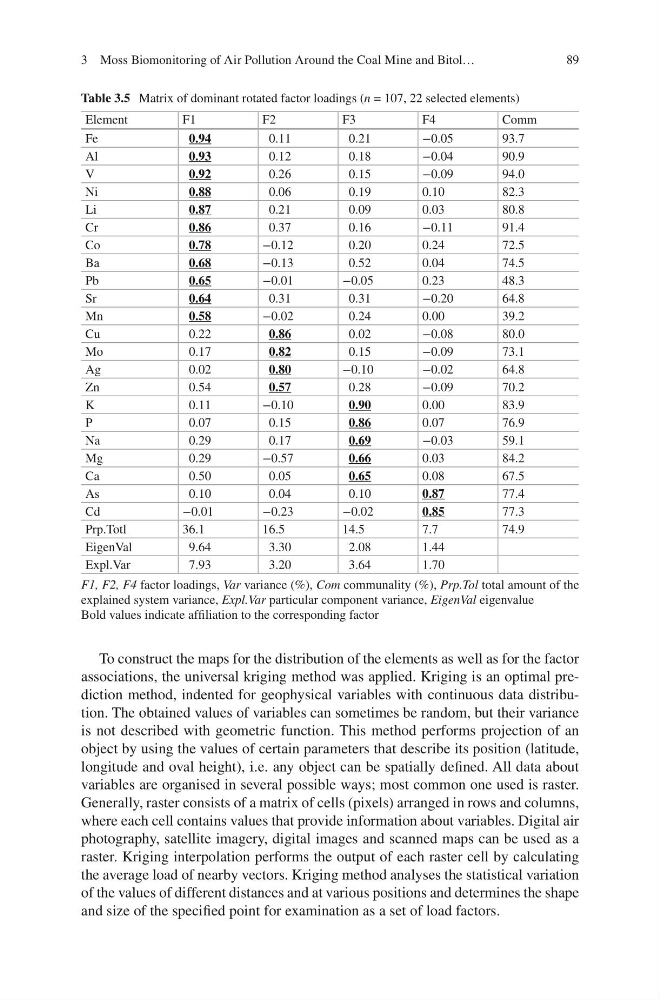
Table 3.5 Matrix of dominant rotated factor loadings (n = 107, 22 selected elements)
Element
F1
F2
F3
F4
Comm
Fe
0.94
0.11
0.21
−0.05
93.7
Al
0.93
0.12
0.18
−0.04
90.9
V
0.92
0.26
0.15
−0.09
94.0
Ni
0.88
0.06
0.19
0.10
82.3
Li
0.87
0.21
0.09
0.03
80.8
Cr
0.86
0.37
0.16
−0.11
91.4
Co
0.78
−0.12
0.20
0.24
72.5
Ba
0.68
−0.13
0.52
0.04
74.5
Pb
0.65
−0.01
−0.05
0.23
48.3
Sr
0.64
0.31
0.31
−0.20
64.8
Mn
0.58
−0.02
0.24
0.00
39.2
Cu
0.22
0.86
0.02
−0.08
80.0
Mo
0.17
0.82
0.15
−0.09
73.1
Ag
0.02
0.80
−0.10
−0.02
64.8
Zn
0.54
0.57
0.28
−0.09
70.2
K
0.11
−0.10
0.90
0.00
83.9
P
0.07
0.15
0.86
0.07
76.9
Na
0.29
0.17
0.69
−0.03
59.1
Mg
0.29
−0.57
0.66
0.03
84.2
Ca
0.50
0.05
0.65
0.08
67.5
As
0.10
0.04
0.10
0.87
77.4
Cd
−0.01
−0.23
−0.02
0.85
77.3
Prp.Totl
36.1
16.5
14.5
7.7
74.9
EigenVal
9.64
3.30
2.08
1.44
Expl.Var
7.93
3.20
3.64
1.70
F1, F2, F4 factor loadings, Var variance (%), Com communality (%), Prp.Tol total amount of the
explained system variance, Expl.Var particular component variance, EigenVal eigenvalue
Bold values indicate affiliation to the corresponding factor
3 Moss Biomonitoring of Air Pollution Around the Coal Mine and Bitol…
To construct the maps for the distribution of the elements as well as for the factor
associations, the universal kriging method was applied. Kriging is an optimal prediction method, indented for geophysical variables with continuous data distribution. The obtained values of variables can sometimes be random, but their variance
is not described with geometric function. This method performs projection of an
object by using the values of certain parameters that describe its position (latitude,
longitude and oval height), i.e. any object can be spatially defined. All data about
variables are organised in several possible ways; most common one used is raster.
Generally, raster consists of a matrix of cells (pixels) arranged in rows and columns,
where each cell contains values that provide information about variables. Digital air
photography, satellite imagery, digital images and scanned maps can be used as a
raster. Kriging interpolation performs the output of each raster cell by calculating
the average load of nearby vectors. Kriging method analyses the statistical variation
of the values of different distances and at various positions and determines the shape
and size of the specified point for examination as a set of load factors.
Table 3.5 Matrix of dominant rotated factor loadings (n = 107, 22 selected elements)
Element
F1
F2
F3
F4
Comm
Fe
0.94
0.11
0.21
−0.05
93.7
Al
0.93
0.12
0.18
−0.04
90.9
V
0.92
0.26
0.15
−0.09
94.0
Ni
0.88
0.06
0.19
0.10
82.3
Li
0.87
0.21
0.09
0.03
80.8
Cr
0.86
0.37
0.16
−0.11
91.4
Co
0.78
−0.12
0.20
0.24
72.5
Ba
0.68
−0.13
0.52
0.04
74.5
Pb
0.65
−0.01
−0.05
0.23
48.3
Sr
0.64
0.31
0.31
−0.20
64.8
Mn
0.58
−0.02
0.24
0.00
39.2
Cu
0.22
0.86
0.02
−0.08
80.0
Mo
0.17
0.82
0.15
−0.09
73.1
Ag
0.02
0.80
−0.10
−0.02
64.8
Zn
0.54
0.57
0.28
−0.09
70.2
K
0.11
−0.10
0.90
0.00
83.9
P
0.07
0.15
0.86
0.07
76.9
Na
0.29
0.17
0.69
−0.03
59.1
Mg
0.29
−0.57
0.66
0.03
84.2
Ca
0.50
0.05
0.65
0.08
67.5
As
0.10
0.04
0.10
0.87
77.4
Cd
−0.01
−0.23
−0.02
0.85
77.3
Prp.Totl
36.1
16.5
14.5
7.7
74.9
EigenVal
9.64
3.30
2.08
1.44
Expl.Var
7.93
3.20
3.64
1.70
F1, F2, F4 factor loadings, Var variance (%), Com communality (%), Prp.Tol total amount of the
explained system variance, Expl.Var particular component variance, EigenVal eigenvalue
Bold values indicate affiliation to the corresponding factor
3 Moss Biomonitoring of Air Pollution Around the Coal Mine and Bitol…