

44
L. S. Franca et al.
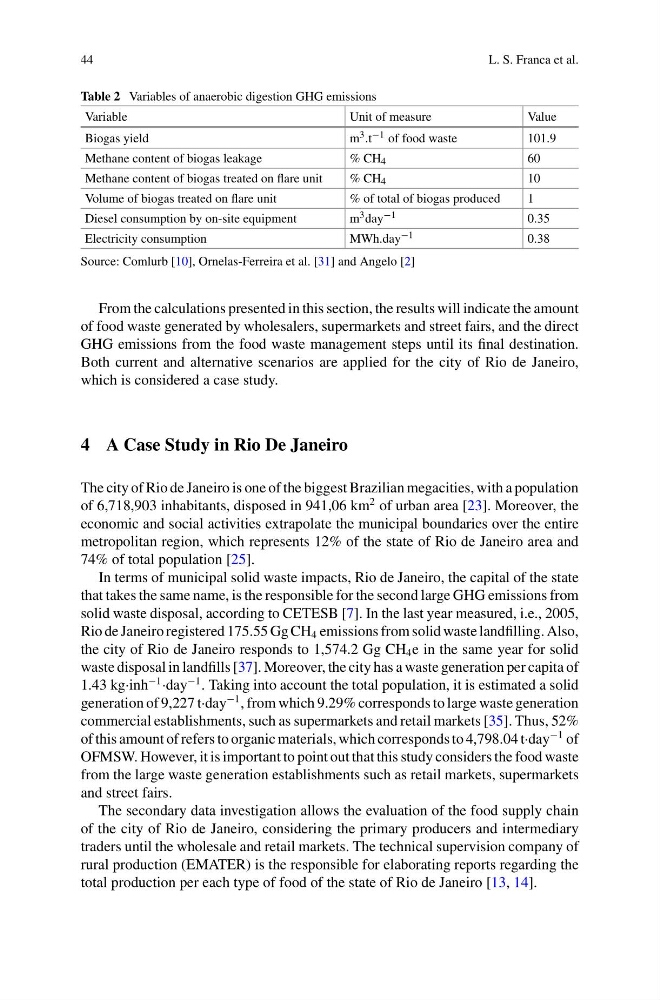
Table 2 Variables of anaerobic digestion GHG emissions
Variable
Unit of measure
Value
Biogas yield
m 3 .t −1 of food waste
101.9
Methane content of biogas leakage
% CH 4
60
Methane content of biogas treated on flare unit
% CH 4
10
Volume of biogas treated on flare unit
% of total of biogas produced
1
Diesel consumption by on-site equipment
m 3 day −1
0.35
Electricity consumption
MWh.day −1
0.38
Source: Comlurb [10], Ornelas-Ferreira et al. [31] and Angelo [2]
From the calculations presented in this section, the results will indicate the amount
of food waste generated by wholesalers, supermarkets and street fairs, and the direct
GHG emissions from the food waste management steps until its final destination.
Both current and alternative scenarios are applied for the city of Rio de Janeiro,
which is considered a case study.
4 A Case Study in Rio De Janeiro
The city of Rio de Janeiro is one of the biggest Brazilian megacities, with a population
of 6,718,903 inhabitants, disposed in 941,06 km
2 of urban area [23]. Moreover, the
economic and social activities extrapolate the municipal boundaries over the entire
metropolitan region, which represents 12% of the state of Rio de Janeiro area and
74% of total population [25].
In terms of municipal solid waste impacts, Rio de Janeiro, the capital of the state
that takes the same name, is the responsible for the second large GHG emissions from
solid waste disposal, according to CETESB [7]. In the last year measured, i.e., 2005,
Rio de Janeiro registered 175.55 Gg CH 4 emissions from solid waste landfilling. Also,
the city of Rio de Janeiro responds to 1,574.2 Gg CH 4 e in the same year for solid
waste disposal in landfills [37]. Moreover, the city has a waste generation per capita of
1.43 kg·inh
−1 ·day
−1 . Taking into account the total population, it is estimated a solid
generation of 9,227 t·day
−1 , from which 9.29% corresponds to large waste generation
commercial establishments, such as supermarkets and retail markets [35]. Thus, 52%
of this amount of refers to organic materials, which corresponds to 4,798.04 t·day
−1 of
OFMSW. However, it is important to point out that this study considers the food waste
from the large waste generation establishments such as retail markets, supermarkets
and street fairs.
The secondary data investigation allows the evaluation of the food supply chain
of the city of Rio de Janeiro, considering the primary producers and intermediary
traders until the wholesale and retail markets. The technical supervision company of
rural production (EMATER) is the responsible for elaborating reports regarding the
total production per each type of food of the state of Rio de Janeiro [13, 14].
L. S. Franca et al.
Table 2 Variables of anaerobic digestion GHG emissions
Variable
Unit of measure
Value
Biogas yield
m 3 .t −1 of food waste
101.9
Methane content of biogas leakage
% CH 4
60
Methane content of biogas treated on flare unit
% CH 4
10
Volume of biogas treated on flare unit
% of total of biogas produced
1
Diesel consumption by on-site equipment
m 3 day −1
0.35
Electricity consumption
MWh.day −1
0.38
Source: Comlurb [10], Ornelas-Ferreira et al. [31] and Angelo [2]
From the calculations presented in this section, the results will indicate the amount
of food waste generated by wholesalers, supermarkets and street fairs, and the direct
GHG emissions from the food waste management steps until its final destination.
Both current and alternative scenarios are applied for the city of Rio de Janeiro,
which is considered a case study.
4 A Case Study in Rio De Janeiro
The city of Rio de Janeiro is one of the biggest Brazilian megacities, with a population
of 6,718,903 inhabitants, disposed in 941,06 km
2 of urban area [23]. Moreover, the
economic and social activities extrapolate the municipal boundaries over the entire
metropolitan region, which represents 12% of the state of Rio de Janeiro area and
74% of total population [25].
In terms of municipal solid waste impacts, Rio de Janeiro, the capital of the state
that takes the same name, is the responsible for the second large GHG emissions from
solid waste disposal, according to CETESB [7]. In the last year measured, i.e., 2005,
Rio de Janeiro registered 175.55 Gg CH 4 emissions from solid waste landfilling. Also,
the city of Rio de Janeiro responds to 1,574.2 Gg CH 4 e in the same year for solid
waste disposal in landfills [37]. Moreover, the city has a waste generation per capita of
1.43 kg·inh
−1 ·day
−1 . Taking into account the total population, it is estimated a solid
generation of 9,227 t·day
−1 , from which 9.29% corresponds to large waste generation
commercial establishments, such as supermarkets and retail markets [35]. Thus, 52%
of this amount of refers to organic materials, which corresponds to 4,798.04 t·day
−1 of
OFMSW. However, it is important to point out that this study considers the food waste
from the large waste generation establishments such as retail markets, supermarkets
and street fairs.
The secondary data investigation allows the evaluation of the food supply chain
of the city of Rio de Janeiro, considering the primary producers and intermediary
traders until the wholesale and retail markets. The technical supervision company of
rural production (EMATER) is the responsible for elaborating reports regarding the
total production per each type of food of the state of Rio de Janeiro [13, 14].