

146
M. Gautam and M. Agrawal
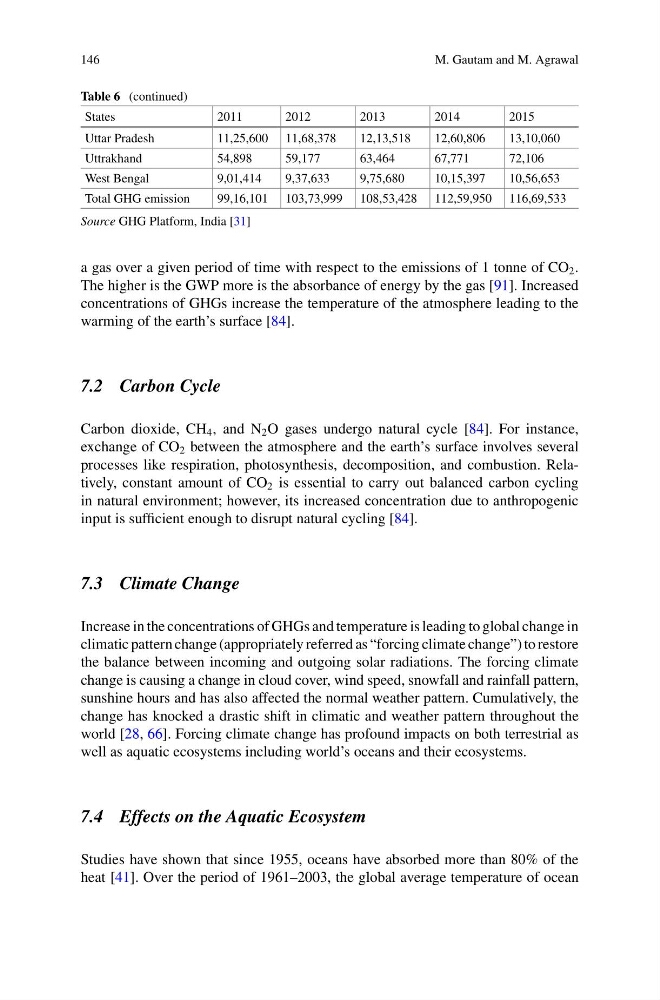
Table 6 (continued)
States
2011
2012
2013
2014
2015
Uttar Pradesh
11,25,600 11,68,378
12,13,518
12,60,806
13,10,060
Uttrakhand
54,898
59,177
63,464
67,771
72,106
West Bengal
9,01,414
9,37,633
9,75,680
10,15,397
10,56,653
Total GHG emission
99,16,101 103,73,999 108,53,428 112,59,950 116,69,533
Source GHG Platform, India [31]
a gas over a given period of time with respect to the emissions of 1 tonne of CO 2 .
The higher is the GWP more is the absorbance of energy by the gas [91]. Increased
concentrations of GHGs increase the temperature of the atmosphere leading to the
warming of the earth’s surface [84].
7.2 Carbon Cycle
Carbon dioxide, CH 4 , and N 2 O gases undergo natural cycle [84]. For instance,
exchange of CO 2 between the atmosphere and the earth’s surface involves several
processes like respiration, photosynthesis, decomposition, and combustion. Relatively, constant amount of CO 2 is essential to carry out balanced carbon cycling
in natural environment; however, its increased concentration due to anthropogenic
input is sufficient enough to disrupt natural cycling [84].
7.3 Climate Change
Increase in the concentrations of GHGs and temperature is leading to global change in
climatic pattern change (appropriately referred as “forcing climate change”) to restore
the balance between incoming and outgoing solar radiations. The forcing climate
change is causing a change in cloud cover, wind speed, snowfall and rainfall pattern,
sunshine hours and has also affected the normal weather pattern. Cumulatively, the
change has knocked a drastic shift in climatic and weather pattern throughout the
world [28, 66]. Forcing climate change has profound impacts on both terrestrial as
well as aquatic ecosystems including world’s oceans and their ecosystems.
7.4 Effects on the Aquatic Ecosystem
Studies have shown that since 1955, oceans have absorbed more than 80% of the
heat [41]. Over the period of 1961–2003, the global average temperature of ocean
M. Gautam and M. Agrawal
Table 6 (continued)
States
2011
2012
2013
2014
2015
Uttar Pradesh
11,25,600 11,68,378
12,13,518
12,60,806
13,10,060
Uttrakhand
54,898
59,177
63,464
67,771
72,106
West Bengal
9,01,414
9,37,633
9,75,680
10,15,397
10,56,653
Total GHG emission
99,16,101 103,73,999 108,53,428 112,59,950 116,69,533
Source GHG Platform, India [31]
a gas over a given period of time with respect to the emissions of 1 tonne of CO 2 .
The higher is the GWP more is the absorbance of energy by the gas [91]. Increased
concentrations of GHGs increase the temperature of the atmosphere leading to the
warming of the earth’s surface [84].
7.2 Carbon Cycle
Carbon dioxide, CH 4 , and N 2 O gases undergo natural cycle [84]. For instance,
exchange of CO 2 between the atmosphere and the earth’s surface involves several
processes like respiration, photosynthesis, decomposition, and combustion. Relatively, constant amount of CO 2 is essential to carry out balanced carbon cycling
in natural environment; however, its increased concentration due to anthropogenic
input is sufficient enough to disrupt natural cycling [84].
7.3 Climate Change
Increase in the concentrations of GHGs and temperature is leading to global change in
climatic pattern change (appropriately referred as “forcing climate change”) to restore
the balance between incoming and outgoing solar radiations. The forcing climate
change is causing a change in cloud cover, wind speed, snowfall and rainfall pattern,
sunshine hours and has also affected the normal weather pattern. Cumulatively, the
change has knocked a drastic shift in climatic and weather pattern throughout the
world [28, 66]. Forcing climate change has profound impacts on both terrestrial as
well as aquatic ecosystems including world’s oceans and their ecosystems.
7.4 Effects on the Aquatic Ecosystem
Studies have shown that since 1955, oceans have absorbed more than 80% of the
heat [41]. Over the period of 1961–2003, the global average temperature of ocean