

Greenhouse Gas Emissions from Municipal Solid Waste Management …
129
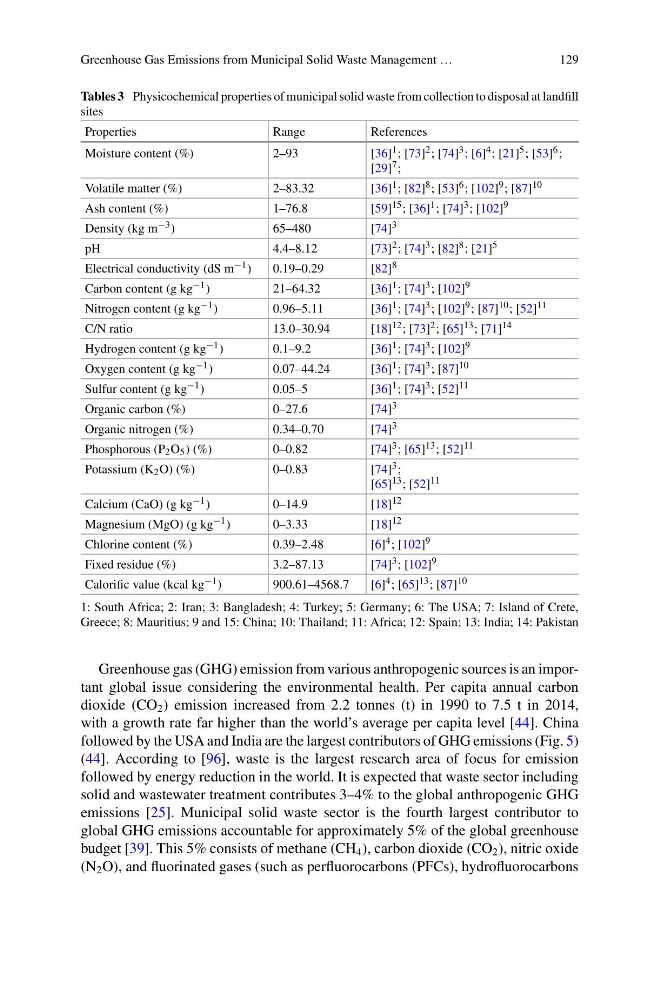
Tables 3 Physicochemical properties of municipal solid waste from collection to disposal at landfill
sites
Properties
Range
References
Moisture content (%)
2–93
[36] 1 ; [73] 2 ; [74] 3 ; [6] 4 ; [21] 5 ; [53] 6 ;
[29] 7 ;
Volatile matter (%)
2–83.32
[36] 1 ; [82] 8 ; [53] 6 ; [102] 9 ; [87] 10
Ash content (%)
1–76.8
[59] 15 ; [36] 1 ; [74] 3 ; [102] 9
Density (kg m −3 )
65–480
[74] 3
pH
4.4–8.12
[73] 2 ; [74] 3 ; [82] 8 ; [21] 5
Electrical conductivity (dS m −1 )
0.19–0.29
[82] 8
Carbon content (g kg −1 )
21–64.32
[36] 1 ; [74] 3 ; [102] 9
Nitrogen content (g kg −1 )
0.96–5.11
[36] 1 ; [74] 3 ; [102] 9 ; [87] 10 ; [52] 11
C/N ratio
13.0–30.94
[18] 12 ; [73] 2 ; [65] 13 ; [71] 14
Hydrogen content (g kg −1 )
0.1–9.2
[36] 1 ; [74] 3 ; [102] 9
Oxygen content (g kg −1 )
0.07–44.24
[36] 1 ; [74] 3 ; [87] 10
Sulfur content (g kg −1 )
0.05–5
[36] 1 ; [74] 3 ; [52] 11
Organic carbon (%)
0–27.6
[74] 3
Organic nitrogen (%)
0.34–0.70
[74] 3
Phosphorous (P 2 O 5 ) (%)
0–0.82
[74] 3 ; [65] 13 ; [52] 11
Potassium (K 2 O) (%)
0–0.83
[74] 3 ;
[65] 13 ; [52] 11
Calcium (CaO) (g kg −1 )
0–14.9
[18] 12
Magnesium (MgO) (g kg −1 )
0–3.33
[18] 12
Chlorine content (%)
0.39–2.48
[6] 4 ; [102] 9
Fixed residue (%)
3.2–87.13
[74] 3 ; [102] 9
Calorific value (kcal kg −1 )
900.61–4568.7
[6] 4 ; [65] 13 ; [87] 10
1: South Africa; 2: Iran; 3: Bangladesh; 4: Turkey; 5: Germany; 6: The USA; 7: Island of Crete,
Greece; 8: Mauritius; 9 and 15: China; 10: Thailand; 11: Africa; 12: Spain; 13: India; 14: Pakistan
Greenhouse gas (GHG) emission from various anthropogenic sources is an important global issue considering the environmental health. Per capita annual carbon
dioxide (CO 2 ) emission increased from 2.2 tonnes (t) in 1990 to 7.5 t in 2014,
with a growth rate far higher than the world’s average per capita level [44]. China
followed by the USA and India are the largest contributors of GHG emissions (Fig. 5)
(44]. According to [96], waste is the largest research area of focus for emission
followed by energy reduction in the world. It is expected that waste sector including
solid and wastewater treatment contributes 3–4% to the global anthropogenic GHG
emissions [25]. Municipal solid waste sector is the fourth largest contributor to
global GHG emissions accountable for approximately 5% of the global greenhouse
budget [39]. This 5% consists of methane (CH 4 ), carbon dioxide (CO 2 ), nitric oxide
(N 2 O), and fluorinated gases (such as perfluorocarbons (PFCs), hydrofluorocarbons
129
Tables 3 Physicochemical properties of municipal solid waste from collection to disposal at landfill
sites
Properties
Range
References
Moisture content (%)
2–93
[36] 1 ; [73] 2 ; [74] 3 ; [6] 4 ; [21] 5 ; [53] 6 ;
[29] 7 ;
Volatile matter (%)
2–83.32
[36] 1 ; [82] 8 ; [53] 6 ; [102] 9 ; [87] 10
Ash content (%)
1–76.8
[59] 15 ; [36] 1 ; [74] 3 ; [102] 9
Density (kg m −3 )
65–480
[74] 3
pH
4.4–8.12
[73] 2 ; [74] 3 ; [82] 8 ; [21] 5
Electrical conductivity (dS m −1 )
0.19–0.29
[82] 8
Carbon content (g kg −1 )
21–64.32
[36] 1 ; [74] 3 ; [102] 9
Nitrogen content (g kg −1 )
0.96–5.11
[36] 1 ; [74] 3 ; [102] 9 ; [87] 10 ; [52] 11
C/N ratio
13.0–30.94
[18] 12 ; [73] 2 ; [65] 13 ; [71] 14
Hydrogen content (g kg −1 )
0.1–9.2
[36] 1 ; [74] 3 ; [102] 9
Oxygen content (g kg −1 )
0.07–44.24
[36] 1 ; [74] 3 ; [87] 10
Sulfur content (g kg −1 )
0.05–5
[36] 1 ; [74] 3 ; [52] 11
Organic carbon (%)
0–27.6
[74] 3
Organic nitrogen (%)
0.34–0.70
[74] 3
Phosphorous (P 2 O 5 ) (%)
0–0.82
[74] 3 ; [65] 13 ; [52] 11
Potassium (K 2 O) (%)
0–0.83
[74] 3 ;
[65] 13 ; [52] 11
Calcium (CaO) (g kg −1 )
0–14.9
[18] 12
Magnesium (MgO) (g kg −1 )
0–3.33
[18] 12
Chlorine content (%)
0.39–2.48
[6] 4 ; [102] 9
Fixed residue (%)
3.2–87.13
[74] 3 ; [102] 9
Calorific value (kcal kg −1 )
900.61–4568.7
[6] 4 ; [65] 13 ; [87] 10
1: South Africa; 2: Iran; 3: Bangladesh; 4: Turkey; 5: Germany; 6: The USA; 7: Island of Crete,
Greece; 8: Mauritius; 9 and 15: China; 10: Thailand; 11: Africa; 12: Spain; 13: India; 14: Pakistan
Greenhouse gas (GHG) emission from various anthropogenic sources is an important global issue considering the environmental health. Per capita annual carbon
dioxide (CO 2 ) emission increased from 2.2 tonnes (t) in 1990 to 7.5 t in 2014,
with a growth rate far higher than the world’s average per capita level [44]. China
followed by the USA and India are the largest contributors of GHG emissions (Fig. 5)
(44]. According to [96], waste is the largest research area of focus for emission
followed by energy reduction in the world. It is expected that waste sector including
solid and wastewater treatment contributes 3–4% to the global anthropogenic GHG
emissions [25]. Municipal solid waste sector is the fourth largest contributor to
global GHG emissions accountable for approximately 5% of the global greenhouse
budget [39]. This 5% consists of methane (CH 4 ), carbon dioxide (CO 2 ), nitric oxide
(N 2 O), and fluorinated gases (such as perfluorocarbons (PFCs), hydrofluorocarbons