

Ascertainment of Ecological Footprint …
91
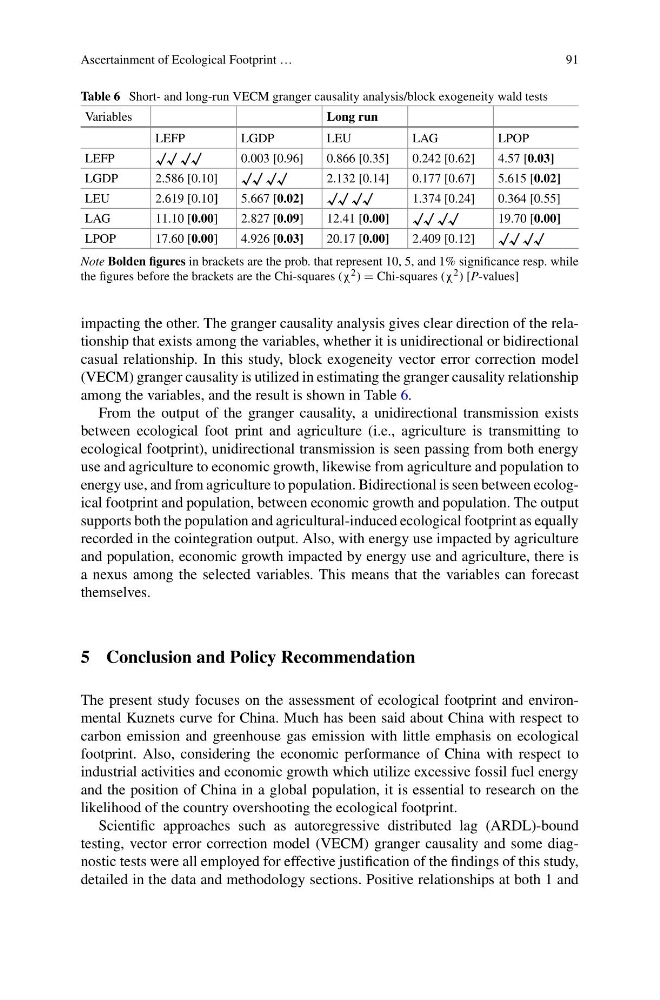
Table 6 Short- and long-run VECM granger causality analysis/block exogeneity wald tests
Variables
Long run
LEFP
LGDP
LEU
LAG
LPOP
LEFP
√√ √√
0.003 [0.96]
0.866 [0.35]
0.242 [0.62]
4.57 [0.03]
LGDP
2.586 [0.10]
√√ √√
2.132 [0.14]
0.177 [0.67]
5.615 [0.02]
LEU
2.619 [0.10]
5.667 [0.02]
√√ √√
1.374 [0.24]
0.364 [0.55]
LAG
11.10 [0.00]
2.827 [0.09]
12.41 [0.00]
√√ √√
19.70 [0.00]
LPOP
17.60 [0.00]
4.926 [0.03]
20.17 [0.00]
2.409 [0.12]
√√ √√
Note Bolden figures in brackets are the prob. that represent 10, 5, and 1% significance resp. while
the figures before the brackets are the Chi-squares (χ 2 ) = Chi-squares (χ 2 ) [P-values]
impacting the other. The granger causality analysis gives clear direction of the relationship that exists among the variables, whether it is unidirectional or bidirectional
casual relationship. In this study, block exogeneity vector error correction model
(VECM) granger causality is utilized in estimating the granger causality relationship
among the variables, and the result is shown in Table 6.
From the output of the granger causality, a unidirectional transmission exists
between ecological foot print and agriculture (i.e., agriculture is transmitting to
ecological footprint), unidirectional transmission is seen passing from both energy
use and agriculture to economic growth, likewise from agriculture and population to
energy use, and from agriculture to population. Bidirectional is seen between ecological footprint and population, between economic growth and population. The output
supports both the population and agricultural-induced ecological footprint as equally
recorded in the cointegration output. Also, with energy use impacted by agriculture
and population, economic growth impacted by energy use and agriculture, there is
a nexus among the selected variables. This means that the variables can forecast
themselves.
5 Conclusion and Policy Recommendation
The present study focuses on the assessment of ecological footprint and environmental Kuznets curve for China. Much has been said about China with respect to
carbon emission and greenhouse gas emission with little emphasis on ecological
footprint. Also, considering the economic performance of China with respect to
industrial activities and economic growth which utilize excessive fossil fuel energy
and the position of China in a global population, it is essential to research on the
likelihood of the country overshooting the ecological footprint.
Scientific approaches such as autoregressive distributed lag (ARDL)-bound
testing, vector error correction model (VECM) granger causality and some diagnostic tests were all employed for effective justification of the findings of this study,
detailed in the data and methodology sections. Positive relationships at both 1 and
91
Table 6 Short- and long-run VECM granger causality analysis/block exogeneity wald tests
Variables
Long run
LEFP
LGDP
LEU
LAG
LPOP
LEFP
√√ √√
0.003 [0.96]
0.866 [0.35]
0.242 [0.62]
4.57 [0.03]
LGDP
2.586 [0.10]
√√ √√
2.132 [0.14]
0.177 [0.67]
5.615 [0.02]
LEU
2.619 [0.10]
5.667 [0.02]
√√ √√
1.374 [0.24]
0.364 [0.55]
LAG
11.10 [0.00]
2.827 [0.09]
12.41 [0.00]
√√ √√
19.70 [0.00]
LPOP
17.60 [0.00]
4.926 [0.03]
20.17 [0.00]
2.409 [0.12]
√√ √√
Note Bolden figures in brackets are the prob. that represent 10, 5, and 1% significance resp. while
the figures before the brackets are the Chi-squares (χ 2 ) = Chi-squares (χ 2 ) [P-values]
impacting the other. The granger causality analysis gives clear direction of the relationship that exists among the variables, whether it is unidirectional or bidirectional
casual relationship. In this study, block exogeneity vector error correction model
(VECM) granger causality is utilized in estimating the granger causality relationship
among the variables, and the result is shown in Table 6.
From the output of the granger causality, a unidirectional transmission exists
between ecological foot print and agriculture (i.e., agriculture is transmitting to
ecological footprint), unidirectional transmission is seen passing from both energy
use and agriculture to economic growth, likewise from agriculture and population to
energy use, and from agriculture to population. Bidirectional is seen between ecological footprint and population, between economic growth and population. The output
supports both the population and agricultural-induced ecological footprint as equally
recorded in the cointegration output. Also, with energy use impacted by agriculture
and population, economic growth impacted by energy use and agriculture, there is
a nexus among the selected variables. This means that the variables can forecast
themselves.
5 Conclusion and Policy Recommendation
The present study focuses on the assessment of ecological footprint and environmental Kuznets curve for China. Much has been said about China with respect to
carbon emission and greenhouse gas emission with little emphasis on ecological
footprint. Also, considering the economic performance of China with respect to
industrial activities and economic growth which utilize excessive fossil fuel energy
and the position of China in a global population, it is essential to research on the
likelihood of the country overshooting the ecological footprint.
Scientific approaches such as autoregressive distributed lag (ARDL)-bound
testing, vector error correction model (VECM) granger causality and some diagnostic tests were all employed for effective justification of the findings of this study,
detailed in the data and methodology sections. Positive relationships at both 1 and