

Ecological Footprint Assessment …
71
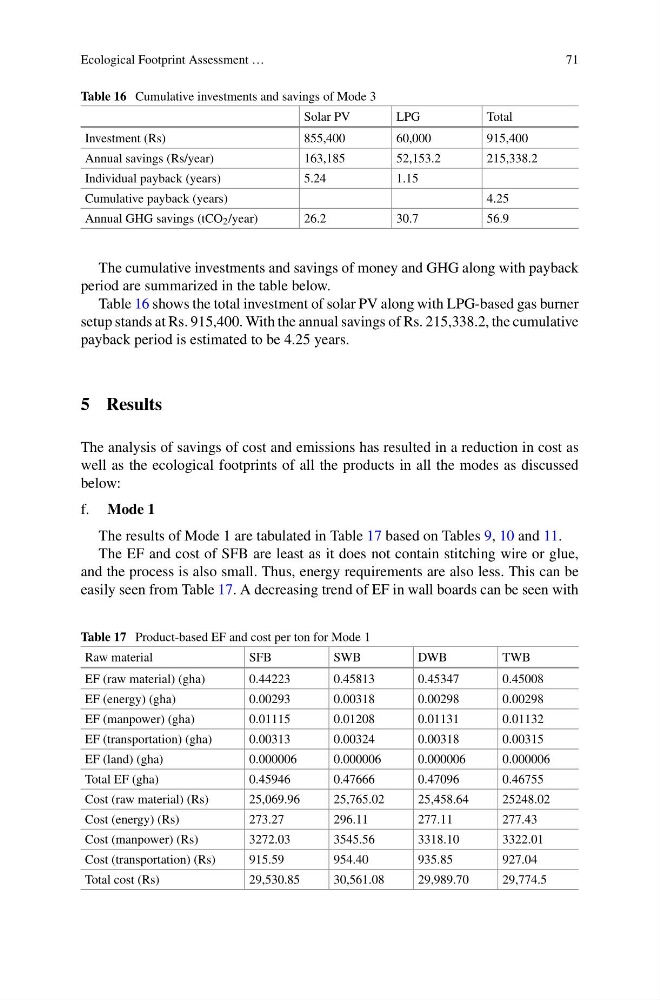
Table 16 Cumulative investments and savings of Mode 3
Solar PV
LPG
Total
Investment (Rs)
855,400
60,000
915,400
Annual savings (Rs/year)
163,185
52,153.2
215,338.2
Individual payback (years)
5.24
1.15
Cumulative payback (years)
4.25
Annual GHG savings (tCO 2 /year)
26.2
30.7
56.9
The cumulative investments and savings of money and GHG along with payback
period are summarized in the table below.
Table 16 shows the total investment of solar PV along with LPG-based gas burner
setup stands at Rs. 915,400. With the annual savings of Rs. 215,338.2, the cumulative
payback period is estimated to be 4.25 years.
5 Results
The analysis of savings of cost and emissions has resulted in a reduction in cost as
well as the ecological footprints of all the products in all the modes as discussed
below:
f. Mode 1
The results of Mode 1 are tabulated in Table 17 based on Tables 9, 10 and 11.
The EF and cost of SFB are least as it does not contain stitching wire or glue,
and the process is also small. Thus, energy requirements are also less. This can be
easily seen from Table 17. A decreasing trend of EF in wall boards can be seen with
Table 17 Product-based EF and cost per ton for Mode 1
Raw material
SFB
SWB
DWB
TWB
EF (raw material) (gha)
0.44223
0.45813
0.45347
0.45008
EF (energy) (gha)
0.00293
0.00318
0.00298
0.00298
EF (manpower) (gha)
0.01115
0.01208
0.01131
0.01132
EF (transportation) (gha)
0.00313
0.00324
0.00318
0.00315
EF (land) (gha)
0.000006
0.000006
0.000006
0.000006
Total EF (gha)
0.45946
0.47666
0.47096
0.46755
Cost (raw material) (Rs)
25,069.96
25,765.02
25,458.64
25248.02
Cost (energy) (Rs)
273.27
296.11
277.11
277.43
Cost (manpower) (Rs)
3272.03
3545.56
3318.10
3322.01
Cost (transportation) (Rs)
915.59
954.40
935.85
927.04
Total cost (Rs)
29,530.85
30,561.08
29,989.70
29,774.5
71
Table 16 Cumulative investments and savings of Mode 3
Solar PV
LPG
Total
Investment (Rs)
855,400
60,000
915,400
Annual savings (Rs/year)
163,185
52,153.2
215,338.2
Individual payback (years)
5.24
1.15
Cumulative payback (years)
4.25
Annual GHG savings (tCO 2 /year)
26.2
30.7
56.9
The cumulative investments and savings of money and GHG along with payback
period are summarized in the table below.
Table 16 shows the total investment of solar PV along with LPG-based gas burner
setup stands at Rs. 915,400. With the annual savings of Rs. 215,338.2, the cumulative
payback period is estimated to be 4.25 years.
5 Results
The analysis of savings of cost and emissions has resulted in a reduction in cost as
well as the ecological footprints of all the products in all the modes as discussed
below:
f. Mode 1
The results of Mode 1 are tabulated in Table 17 based on Tables 9, 10 and 11.
The EF and cost of SFB are least as it does not contain stitching wire or glue,
and the process is also small. Thus, energy requirements are also less. This can be
easily seen from Table 17. A decreasing trend of EF in wall boards can be seen with
Table 17 Product-based EF and cost per ton for Mode 1
Raw material
SFB
SWB
DWB
TWB
EF (raw material) (gha)
0.44223
0.45813
0.45347
0.45008
EF (energy) (gha)
0.00293
0.00318
0.00298
0.00298
EF (manpower) (gha)
0.01115
0.01208
0.01131
0.01132
EF (transportation) (gha)
0.00313
0.00324
0.00318
0.00315
EF (land) (gha)
0.000006
0.000006
0.000006
0.000006
Total EF (gha)
0.45946
0.47666
0.47096
0.46755
Cost (raw material) (Rs)
25,069.96
25,765.02
25,458.64
25248.02
Cost (energy) (Rs)
273.27
296.11
277.11
277.43
Cost (manpower) (Rs)
3272.03
3545.56
3318.10
3322.01
Cost (transportation) (Rs)
915.59
954.40
935.85
927.04
Total cost (Rs)
29,530.85
30,561.08
29,989.70
29,774.5