

18
C. Rivero-Camacho et al.
7.1 Water consumption
For the estimation of water consumption, the starting point is the collection of
data provided by the National Institute of Statistics on the average water consumption per person per year, from 1996 to 2015. In addition, the optimal consumption
value provided by the World Health Organization (WHO) is taken into account,
50 l/inhabitant/day, an amount associated only with human consumption of water
in the home (drinking, cooking, personal hygiene and household cleaning). After
analysing the evolution of water consumption in recent years, a trend towards savings
has been observed and with it, a reduction in water consumption. In the year 2000,
average water consumption in Spanish households was above 150 L per person per
day, compared to 132 L per person per day in 2018, according to the latest data
collected by the National Statistics Institute [91].
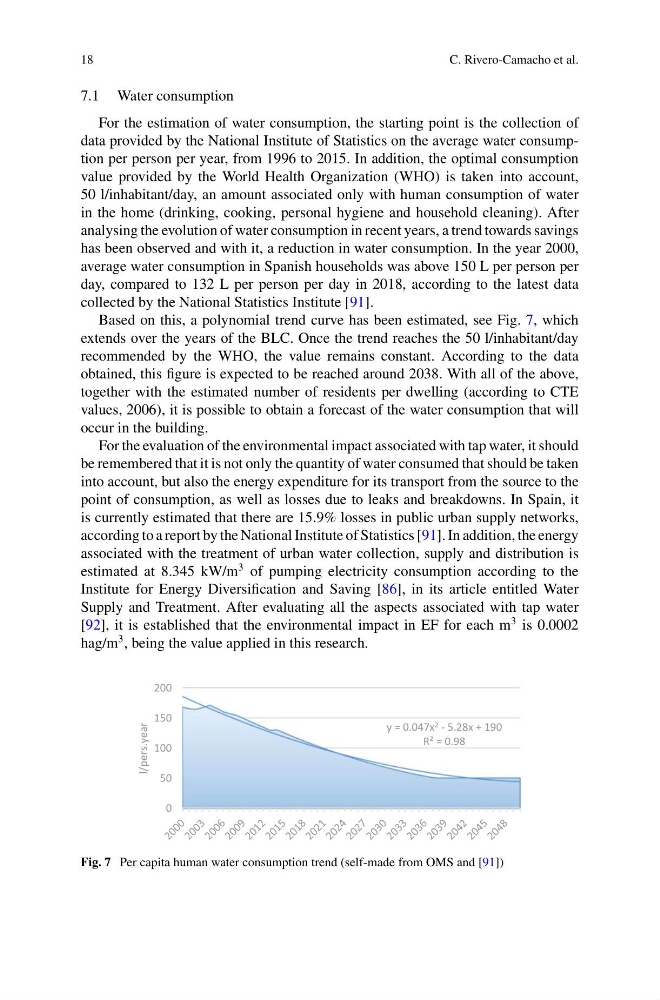
Based on this, a polynomial trend curve has been estimated, see Fig. 7, which
extends over the years of the BLC. Once the trend reaches the 50 l/inhabitant/day
recommended by the WHO, the value remains constant. According to the data
obtained, this figure is expected to be reached around 2038. With all of the above,
together with the estimated number of residents per dwelling (according to CTE
values, 2006), it is possible to obtain a forecast of the water consumption that will
occur in the building.
For the evaluation of the environmental impact associated with tap water, it should
be remembered that it is not only the quantity of water consumed that should be taken
into account, but also the energy expenditure for its transport from the source to the
point of consumption, as well as losses due to leaks and breakdowns. In Spain, it
is currently estimated that there are 15.9% losses in public urban supply networks,
according to a report by the National Institute of Statistics [91]. In addition, the energy
associated with the treatment of urban water collection, supply and distribution is
estimated at 8.345 kW/m
3 of pumping electricity consumption according to the
Institute for Energy Diversification and Saving [86], in its article entitled Water
Supply and Treatment. After evaluating all the aspects associated with tap water
[92], it is established that the environmental impact in EF for each m
3 is 0.0002
hag/m
3 , being the value applied in this research.
y = 0.047x 2 - 5.28x + 190
R² = 0.98
0
50
100
150
200
l/pers.year
Fig. 7 Per capita human water consumption trend (self-made from OMS and [91])
C. Rivero-Camacho et al.
7.1 Water consumption
For the estimation of water consumption, the starting point is the collection of
data provided by the National Institute of Statistics on the average water consumption per person per year, from 1996 to 2015. In addition, the optimal consumption
value provided by the World Health Organization (WHO) is taken into account,
50 l/inhabitant/day, an amount associated only with human consumption of water
in the home (drinking, cooking, personal hygiene and household cleaning). After
analysing the evolution of water consumption in recent years, a trend towards savings
has been observed and with it, a reduction in water consumption. In the year 2000,
average water consumption in Spanish households was above 150 L per person per
day, compared to 132 L per person per day in 2018, according to the latest data
collected by the National Statistics Institute [91].
Based on this, a polynomial trend curve has been estimated, see Fig. 7, which
extends over the years of the BLC. Once the trend reaches the 50 l/inhabitant/day
recommended by the WHO, the value remains constant. According to the data
obtained, this figure is expected to be reached around 2038. With all of the above,
together with the estimated number of residents per dwelling (according to CTE
values, 2006), it is possible to obtain a forecast of the water consumption that will
occur in the building.
For the evaluation of the environmental impact associated with tap water, it should
be remembered that it is not only the quantity of water consumed that should be taken
into account, but also the energy expenditure for its transport from the source to the
point of consumption, as well as losses due to leaks and breakdowns. In Spain, it
is currently estimated that there are 15.9% losses in public urban supply networks,
according to a report by the National Institute of Statistics [91]. In addition, the energy
associated with the treatment of urban water collection, supply and distribution is
estimated at 8.345 kW/m
3 of pumping electricity consumption according to the
Institute for Energy Diversification and Saving [86], in its article entitled Water
Supply and Treatment. After evaluating all the aspects associated with tap water
[92], it is established that the environmental impact in EF for each m
3 is 0.0002
hag/m
3 , being the value applied in this research.
y = 0.047x 2 - 5.28x + 190
R² = 0.98
0
50
100
150
200
l/pers.year
Fig. 7 Per capita human water consumption trend (self-made from OMS and [91])