

Ecological Footprint of the Life Cycle of Buildings
13
the understanding of the model by the technicians of the sector and encouraging the
application of the same.
The analysis of environmental costs has been carried out by adapting the evaluation model presented by Solís-Guzmán [80], where the EF indicator was applied
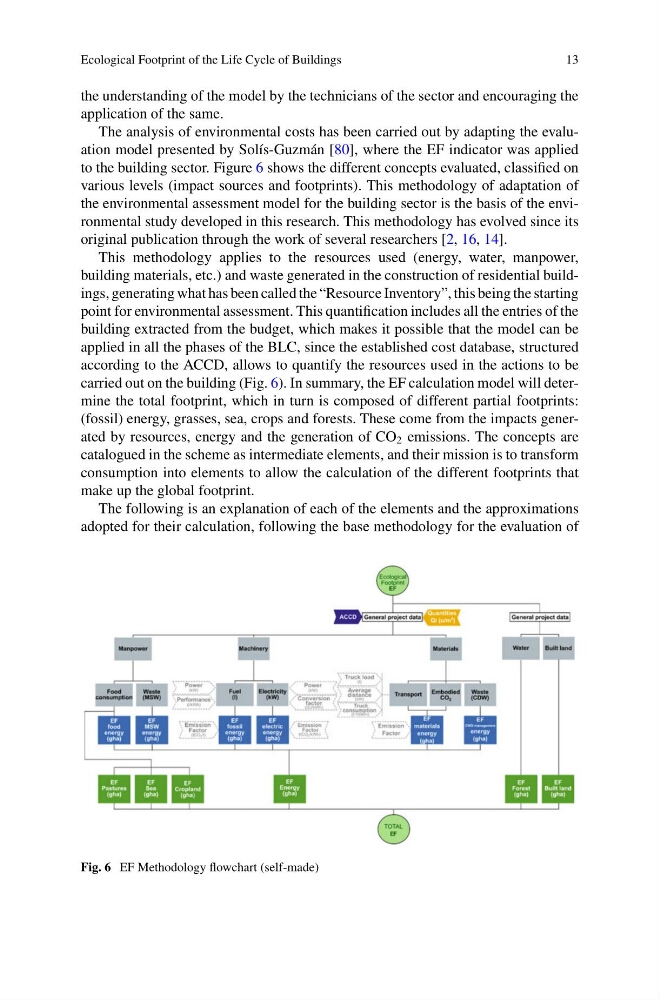
to the building sector. Figure 6 shows the different concepts evaluated, classified on
various levels (impact sources and footprints). This methodology of adaptation of
the environmental assessment model for the building sector is the basis of the environmental study developed in this research. This methodology has evolved since its
original publication through the work of several researchers [2, 16, 14].
This methodology applies to the resources used (energy, water, manpower,
building materials, etc.) and waste generated in the construction of residential buildings, generating what has been called the “Resource Inventory”, this being the starting
point for environmental assessment. This quantification includes all the entries of the
building extracted from the budget, which makes it possible that the model can be
applied in all the phases of the BLC, since the established cost database, structured
according to the ACCD, allows to quantify the resources used in the actions to be
carried out on the building (Fig. 6). In summary, the EF calculation model will determine the total footprint, which in turn is composed of different partial footprints:
(fossil) energy, grasses, sea, crops and forests. These come from the impacts generated by resources, energy and the generation of CO 2 emissions. The concepts are
catalogued in the scheme as intermediate elements, and their mission is to transform
consumption into elements to allow the calculation of the different footprints that
make up the global footprint.
The following is an explanation of each of the elements and the approximations
adopted for their calculation, following the base methodology for the evaluation of
Fig. 6 EF Methodology flowchart (self-made)
13
the understanding of the model by the technicians of the sector and encouraging the
application of the same.
The analysis of environmental costs has been carried out by adapting the evaluation model presented by Solís-Guzmán [80], where the EF indicator was applied
to the building sector. Figure 6 shows the different concepts evaluated, classified on
various levels (impact sources and footprints). This methodology of adaptation of
the environmental assessment model for the building sector is the basis of the environmental study developed in this research. This methodology has evolved since its
original publication through the work of several researchers [2, 16, 14].
This methodology applies to the resources used (energy, water, manpower,
building materials, etc.) and waste generated in the construction of residential buildings, generating what has been called the “Resource Inventory”, this being the starting
point for environmental assessment. This quantification includes all the entries of the
building extracted from the budget, which makes it possible that the model can be
applied in all the phases of the BLC, since the established cost database, structured
according to the ACCD, allows to quantify the resources used in the actions to be
carried out on the building (Fig. 6). In summary, the EF calculation model will determine the total footprint, which in turn is composed of different partial footprints:
(fossil) energy, grasses, sea, crops and forests. These come from the impacts generated by resources, energy and the generation of CO 2 emissions. The concepts are
catalogued in the scheme as intermediate elements, and their mission is to transform
consumption into elements to allow the calculation of the different footprints that
make up the global footprint.
The following is an explanation of each of the elements and the approximations
adopted for their calculation, following the base methodology for the evaluation of
Fig. 6 EF Methodology flowchart (self-made)