

116
E. N. Udemba
which is unsuitable for application of any other approach of cointegration. In this
case, ARDL is considered the best approach for estimating the cointegration and by
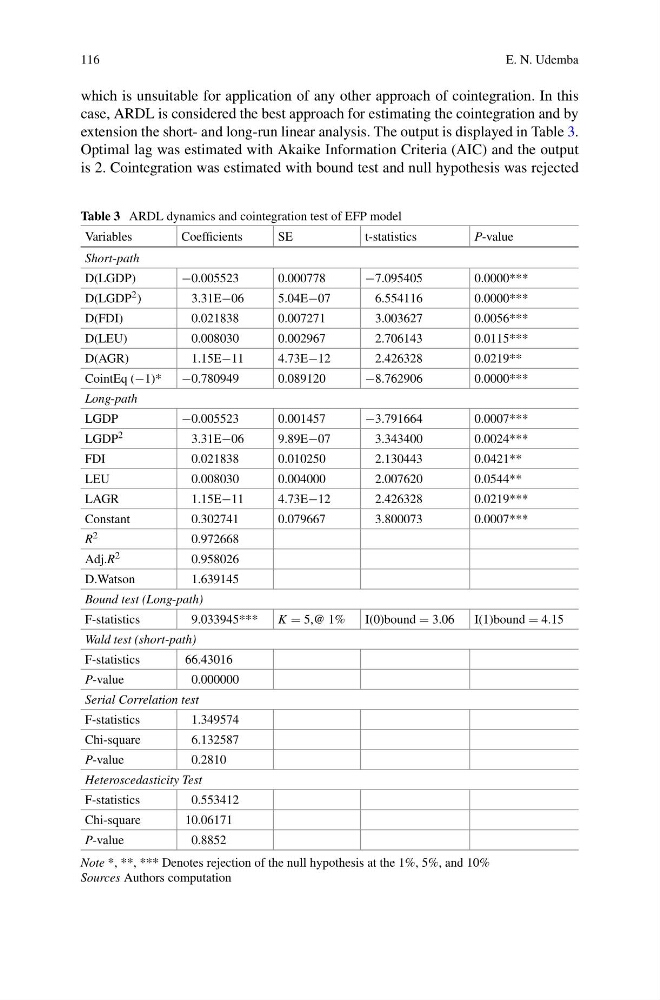
extension the short- and long-run linear analysis. The output is displayed in Table 3.
Optimal lag was estimated with Akaike Information Criteria (AIC) and the output
is 2. Cointegration was estimated with bound test and null hypothesis was rejected
Table 3 ARDL dynamics and cointegration test of EFP model
Variables
Coefficients
SE
t-statistics
P-value
Short-path
D(LGDP)
−0.005523
0.000778
−7.095405
0.0000***
D(LGDP 2 )
3.31E−06
5.04E−07
6.554116
0.0000***
D(FDI)
0.021838
0.007271
3.003627
0.0056***
D(LEU)
0.008030
0.002967
2.706143
0.0115***
D(AGR)
1.15E−11
4.73E−12
2.426328
0.0219**
CointEq (−1)*
−0.780949
0.089120
−8.762906
0.0000***
Long-path
LGDP
−0.005523
0.001457
−3.791664
0.0007***
LGDP 2
3.31E−06
9.89E−07
3.343400
0.0024***
FDI
0.021838
0.010250
2.130443
0.0421**
LEU
0.008030
0.004000
2.007620
0.0544**
LAGR
1.15E−11
4.73E−12
2.426328
0.0219***
Constant
0.302741
0.079667
3.800073
0.0007***
R 2
0.972668
Adj.R 2
0.958026
D.Watson
1.639145
Bound test (Long-path)
F-statistics
9.033945***
K = 5,@ 1%
I(0)bound = 3.06
I(1)bound = 4.15
Wald test (short-path)
F-statistics
66.43016
P-value
0.000000
Serial Correlation test
F-statistics
1.349574
Chi-square
6.132587
P-value
0.2810
Heteroscedasticity Test
F-statistics
0.553412
Chi-square
10.06171
P-value
0.8852
Note *, **, *** Denotes rejection of the null hypothesis at the 1%, 5%, and 10%
Sources Authors computation
E. N. Udemba
which is unsuitable for application of any other approach of cointegration. In this
case, ARDL is considered the best approach for estimating the cointegration and by
extension the short- and long-run linear analysis. The output is displayed in Table 3.
Optimal lag was estimated with Akaike Information Criteria (AIC) and the output
is 2. Cointegration was estimated with bound test and null hypothesis was rejected
Table 3 ARDL dynamics and cointegration test of EFP model
Variables
Coefficients
SE
t-statistics
P-value
Short-path
D(LGDP)
−0.005523
0.000778
−7.095405
0.0000***
D(LGDP 2 )
3.31E−06
5.04E−07
6.554116
0.0000***
D(FDI)
0.021838
0.007271
3.003627
0.0056***
D(LEU)
0.008030
0.002967
2.706143
0.0115***
D(AGR)
1.15E−11
4.73E−12
2.426328
0.0219**
CointEq (−1)*
−0.780949
0.089120
−8.762906
0.0000***
Long-path
LGDP
−0.005523
0.001457
−3.791664
0.0007***
LGDP 2
3.31E−06
9.89E−07
3.343400
0.0024***
FDI
0.021838
0.010250
2.130443
0.0421**
LEU
0.008030
0.004000
2.007620
0.0544**
LAGR
1.15E−11
4.73E−12
2.426328
0.0219***
Constant
0.302741
0.079667
3.800073
0.0007***
R 2
0.972668
Adj.R 2
0.958026
D.Watson
1.639145
Bound test (Long-path)
F-statistics
9.033945***
K = 5,@ 1%
I(0)bound = 3.06
I(1)bound = 4.15
Wald test (short-path)
F-statistics
66.43016
P-value
0.000000
Serial Correlation test
F-statistics
1.349574
Chi-square
6.132587
P-value
0.2810
Heteroscedasticity Test
F-statistics
0.553412
Chi-square
10.06171
P-value
0.8852
Note *, **, *** Denotes rejection of the null hypothesis at the 1%, 5%, and 10%
Sources Authors computation