

228
E. Iwasaki et al.
Table 3 Area of land use classes in 1968–2018
1968
1988
2003
2018
Land use
Area (ha) %
Area (ha) %
Area (ha) %
Area (ha) %
Built-up land 3.2
0.1
48
1.2
67.6
1.7
116.6
2.9
Agricultural
land
1219.6
30.5 1381.9
34.6 1981.8
49.7 2481.6
62.2
Sand dunes
163.2
4.1
432.5
10.8 202.8
5.1
133.9
3.4
Desert
2592.2
64.9 2088.9
52.3 1617.9
40.5 1064.7
26.7
Water bodies 15.6
0.4
39.9
1
121.2
3
194.4
4.9
Source See Table 2
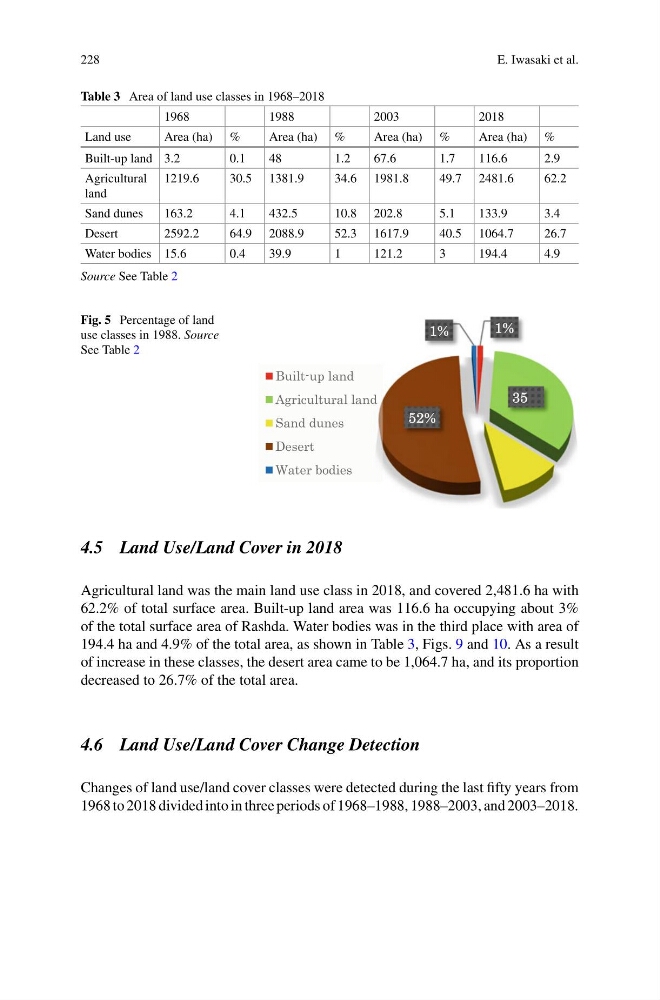
Fig. 5 Percentage of land
use classes in 1988. Source
See Table 2
1%
35
52%
1%
Built-up land
Agricultural land
Sand dunes
Desert
Water bodies
4.5 Land Use/Land Cover in 2018
Agricultural land was the main land use class in 2018, and covered 2,481.6 ha with
62.2% of total surface area. Built-up land area was 116.6 ha occupying about 3%
of the total surface area of Rashda. Water bodies was in the third place with area of
194.4 ha and 4.9% of the total area, as shown in Table 3, Figs. 9 and 10. As a result
of increase in these classes, the desert area came to be 1,064.7 ha, and its proportion
decreased to 26.7% of the total area.
4.6 Land Use/Land Cover Change Detection
Changes of land use/land cover classes were detected during the last fifty years from
1968 to 2018 divided into in three periods of 1968–1988, 1988–2003, and 2003–2018.
E. Iwasaki et al.
Table 3 Area of land use classes in 1968–2018
1968
1988
2003
2018
Land use
Area (ha) %
Area (ha) %
Area (ha) %
Area (ha) %
Built-up land 3.2
0.1
48
1.2
67.6
1.7
116.6
2.9
Agricultural
land
1219.6
30.5 1381.9
34.6 1981.8
49.7 2481.6
62.2
Sand dunes
163.2
4.1
432.5
10.8 202.8
5.1
133.9
3.4
Desert
2592.2
64.9 2088.9
52.3 1617.9
40.5 1064.7
26.7
Water bodies 15.6
0.4
39.9
1
121.2
3
194.4
4.9
Source See Table 2
Fig. 5 Percentage of land
use classes in 1988. Source
See Table 2
1%
35
52%
1%
Built-up land
Agricultural land
Sand dunes
Desert
Water bodies
4.5 Land Use/Land Cover in 2018
Agricultural land was the main land use class in 2018, and covered 2,481.6 ha with
62.2% of total surface area. Built-up land area was 116.6 ha occupying about 3%
of the total surface area of Rashda. Water bodies was in the third place with area of
194.4 ha and 4.9% of the total area, as shown in Table 3, Figs. 9 and 10. As a result
of increase in these classes, the desert area came to be 1,064.7 ha, and its proportion
decreased to 26.7% of the total area.
4.6 Land Use/Land Cover Change Detection
Changes of land use/land cover classes were detected during the last fifty years from
1968 to 2018 divided into in three periods of 1968–1988, 1988–2003, and 2003–2018.