

Hydrologeological and Hydrological …
193
basically connected with the early stages of agricultural reclamation at the beginning
of the 1970s. This drainage system is related to the traditional flooding irrigation
system that represents more than 85% of the irrigation system.
On the other hand, recent trends in irrigation do not depend on drainage networks
only. Drainage of surplus water takes place by transferring water through the networks
to the ponds using pumping stations. Drainage networks differ according to their rank,
some of them are main and others are secondary. Some of these drains are full of
grass which makes it difficult for water flow and hence water infiltrates to the ground
before reaching the pumping station. This leads to fluctuation in water levels inside
the ponds and sometimes some ponds are empty of water due to little or no surplus
water in it in addition to evaporation processes. The total length of drains in Dakhla
Depression is 285.3 km in 2014 and the number of the main and secondary drains
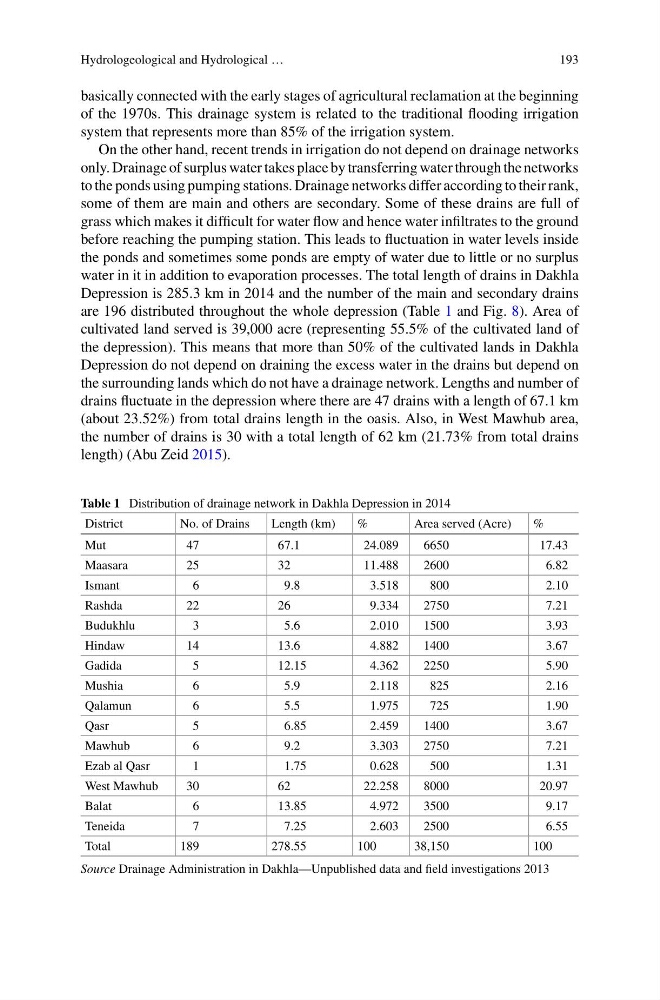
are 196 distributed throughout the whole depression (Table 1 and Fig. 8). Area of
cultivated land served is 39,000 acre (representing 55.5% of the cultivated land of
the depression). This means that more than 50% of the cultivated lands in Dakhla
Depression do not depend on draining the excess water in the drains but depend on
the surrounding lands which do not have a drainage network. Lengths and number of
drains fluctuate in the depression where there are 47 drains with a length of 67.1 km
(about 23.52%) from total drains length in the oasis. Also, in West Mawhub area,
the number of drains is 30 with a total length of 62 km (21.73% from total drains
length) (Abu Zeid 2015).
Table 1 Distribution of drainage network in Dakhla Depression in 2014
District
No. of Drains
Length (km)
%
Area served (Acre)
%
Mut
47
67.1
24.089
6650
17.43
Maasara
25
32
11.488
2600
6.82
Ismant
6
9.8
3.518
800
2.10
Rashda
22
26
9.334
2750
7.21
Budukhlu
3
5.6
2.010
1500
3.93
Hindaw
14
13.6
4.882
1400
3.67
Gadida
5
12.15
4.362
2250
5.90
Mushia
6
5.9
2.118
825
2.16
Qalamun
6
5.5
1.975
725
1.90
Qasr
5
6.85
2.459
1400
3.67
Mawhub
6
9.2
3.303
2750
7.21
Ezab al Qasr
1
1.75
0.628
500
1.31
West Mawhub
30
62
22.258
8000
20.97
Balat
6
13.85
4.972
3500
9.17
Teneida
7
7.25
2.603
2500
6.55
Total
189
278.55
100
38,150
100
Source Drainage Administration in Dakhla—Unpublished data and field investigations 2013
193
basically connected with the early stages of agricultural reclamation at the beginning
of the 1970s. This drainage system is related to the traditional flooding irrigation
system that represents more than 85% of the irrigation system.
On the other hand, recent trends in irrigation do not depend on drainage networks
only. Drainage of surplus water takes place by transferring water through the networks
to the ponds using pumping stations. Drainage networks differ according to their rank,
some of them are main and others are secondary. Some of these drains are full of
grass which makes it difficult for water flow and hence water infiltrates to the ground
before reaching the pumping station. This leads to fluctuation in water levels inside
the ponds and sometimes some ponds are empty of water due to little or no surplus
water in it in addition to evaporation processes. The total length of drains in Dakhla
Depression is 285.3 km in 2014 and the number of the main and secondary drains
are 196 distributed throughout the whole depression (Table 1 and Fig. 8). Area of
cultivated land served is 39,000 acre (representing 55.5% of the cultivated land of
the depression). This means that more than 50% of the cultivated lands in Dakhla
Depression do not depend on draining the excess water in the drains but depend on
the surrounding lands which do not have a drainage network. Lengths and number of
drains fluctuate in the depression where there are 47 drains with a length of 67.1 km
(about 23.52%) from total drains length in the oasis. Also, in West Mawhub area,
the number of drains is 30 with a total length of 62 km (21.73% from total drains
length) (Abu Zeid 2015).
Table 1 Distribution of drainage network in Dakhla Depression in 2014
District
No. of Drains
Length (km)
%
Area served (Acre)
%
Mut
47
67.1
24.089
6650
17.43
Maasara
25
32
11.488
2600
6.82
Ismant
6
9.8
3.518
800
2.10
Rashda
22
26
9.334
2750
7.21
Budukhlu
3
5.6
2.010
1500
3.93
Hindaw
14
13.6
4.882
1400
3.67
Gadida
5
12.15
4.362
2250
5.90
Mushia
6
5.9
2.118
825
2.16
Qalamun
6
5.5
1.975
725
1.90
Qasr
5
6.85
2.459
1400
3.67
Mawhub
6
9.2
3.303
2750
7.21
Ezab al Qasr
1
1.75
0.628
500
1.31
West Mawhub
30
62
22.258
8000
20.97
Balat
6
13.85
4.972
3500
9.17
Teneida
7
7.25
2.603
2500
6.55
Total
189
278.55
100
38,150
100
Source Drainage Administration in Dakhla—Unpublished data and field investigations 2013