

Crop Diversification and Its Efficiency …
169
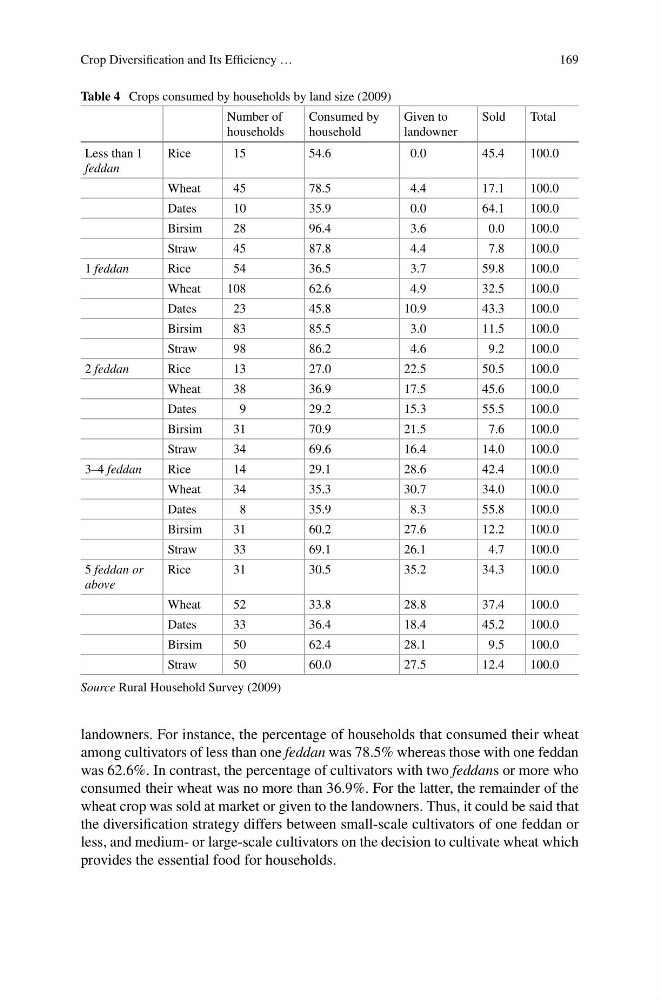
Table 4 Crops consumed by households by land size (2009)
Number of
households
Consumed by
household
Given to
landowner
Sold
Total
Less than 1
feddan
Rice
15
54.6
0.0
45.4
100.0
Wheat
45
78.5
4.4
17.1
100.0
Dates
10
35.9
0.0
64.1
100.0
Birsim
28
96.4
3.6
0.0
100.0
Straw
45
87.8
4.4
7.8
100.0
1 feddan
Rice
54
36.5
3.7
59.8
100.0
Wheat
108
62.6
4.9
32.5
100.0
Dates
23
45.8
10.9
43.3
100.0
Birsim
83
85.5
3.0
11.5
100.0
Straw
98
86.2
4.6
9.2
100.0
2 feddan
Rice
13
27.0
22.5
50.5
100.0
Wheat
38
36.9
17.5
45.6
100.0
Dates
9
29.2
15.3
55.5
100.0
Birsim
31
70.9
21.5
7.6
100.0
Straw
34
69.6
16.4
14.0
100.0
3–4 feddan
Rice
14
29.1
28.6
42.4
100.0
Wheat
34
35.3
30.7
34.0
100.0
Dates
8
35.9
8.3
55.8
100.0
Birsim
31
60.2
27.6
12.2
100.0
Straw
33
69.1
26.1
4.7
100.0
5 feddan or
above
Rice
31
30.5
35.2
34.3
100.0
Wheat
52
33.8
28.8
37.4
100.0
Dates
33
36.4
18.4
45.2
100.0
Birsim
50
62.4
28.1
9.5
100.0
Straw
50
60.0
27.5
12.4
100.0
Source Rural Household Survey (2009)
landowners. For instance, the percentage of households that consumed their wheat
among cultivators of less than one feddan was 78.5% whereas those with one feddan
was 62.6%. In contrast, the percentage of cultivators with two feddans or more who
consumed their wheat was no more than 36.9%. For the latter, the remainder of the
wheat crop was sold at market or given to the landowners. Thus, it could be said that
the diversification strategy differs between small-scale cultivators of one feddan or
less, and medium- or large-scale cultivators on the decision to cultivate wheat which
provides the essential food for households.
169
Table 4 Crops consumed by households by land size (2009)
Number of
households
Consumed by
household
Given to
landowner
Sold
Total
Less than 1
feddan
Rice
15
54.6
0.0
45.4
100.0
Wheat
45
78.5
4.4
17.1
100.0
Dates
10
35.9
0.0
64.1
100.0
Birsim
28
96.4
3.6
0.0
100.0
Straw
45
87.8
4.4
7.8
100.0
1 feddan
Rice
54
36.5
3.7
59.8
100.0
Wheat
108
62.6
4.9
32.5
100.0
Dates
23
45.8
10.9
43.3
100.0
Birsim
83
85.5
3.0
11.5
100.0
Straw
98
86.2
4.6
9.2
100.0
2 feddan
Rice
13
27.0
22.5
50.5
100.0
Wheat
38
36.9
17.5
45.6
100.0
Dates
9
29.2
15.3
55.5
100.0
Birsim
31
70.9
21.5
7.6
100.0
Straw
34
69.6
16.4
14.0
100.0
3–4 feddan
Rice
14
29.1
28.6
42.4
100.0
Wheat
34
35.3
30.7
34.0
100.0
Dates
8
35.9
8.3
55.8
100.0
Birsim
31
60.2
27.6
12.2
100.0
Straw
33
69.1
26.1
4.7
100.0
5 feddan or
above
Rice
31
30.5
35.2
34.3
100.0
Wheat
52
33.8
28.8
37.4
100.0
Dates
33
36.4
18.4
45.2
100.0
Birsim
50
62.4
28.1
9.5
100.0
Straw
50
60.0
27.5
12.4
100.0
Source Rural Household Survey (2009)
landowners. For instance, the percentage of households that consumed their wheat
among cultivators of less than one feddan was 78.5% whereas those with one feddan
was 62.6%. In contrast, the percentage of cultivators with two feddans or more who
consumed their wheat was no more than 36.9%. For the latter, the remainder of the
wheat crop was sold at market or given to the landowners. Thus, it could be said that
the diversification strategy differs between small-scale cultivators of one feddan or
less, and medium- or large-scale cultivators on the decision to cultivate wheat which
provides the essential food for households.