

156
A. Shalaby and H. S. Khedr
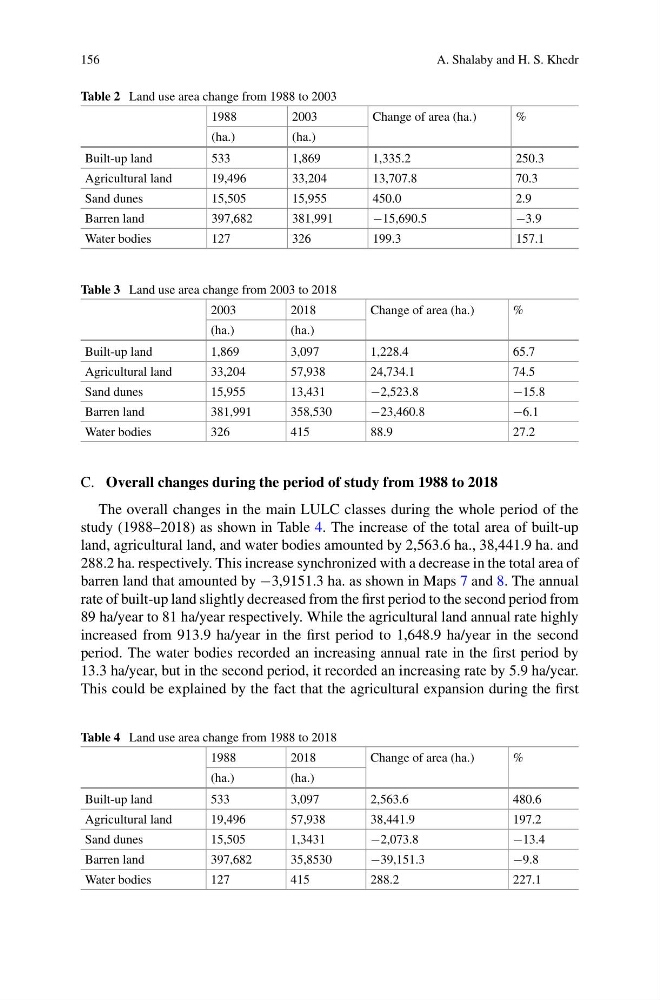
Table 2 Land use area change from 1988 to 2003
1988
2003
Change of area (ha.)
%
(ha.)
(ha.)
Built-up land
533
1,869
1,335.2
250.3
Agricultural land
19,496
33,204
13,707.8
70.3
Sand dunes
15,505
15,955
450.0
2.9
Barren land
397,682
381,991
−15,690.5
−3.9
Water bodies
127
326
199.3
157.1
Table 3 Land use area change from 2003 to 2018
2003
2018
Change of area (ha.)
%
(ha.)
(ha.)
Built-up land
1,869
3,097
1,228.4
65.7
Agricultural land
33,204
57,938
24,734.1
74.5
Sand dunes
15,955
13,431
−2,523.8
−15.8
Barren land
381,991
358,530
−23,460.8
−6.1
Water bodies
326
415
88.9
27.2
C. Overall changes during the period of study from 1988 to 2018
The overall changes in the main LULC classes during the whole period of the
study (1988–2018) as shown in Table 4. The increase of the total area of built-up
land, agricultural land, and water bodies amounted by 2,563.6 ha., 38,441.9 ha. and
288.2 ha. respectively. This increase synchronized with a decrease in the total area of
barren land that amounted by −3,9151.3 ha. as shown in Maps 7 and 8. The annual
rate of built-up land slightly decreased from the first period to the second period from
89 ha/year to 81 ha/year respectively. While the agricultural land annual rate highly
increased from 913.9 ha/year in the first period to 1,648.9 ha/year in the second
period. The water bodies recorded an increasing annual rate in the first period by
13.3 ha/year, but in the second period, it recorded an increasing rate by 5.9 ha/year.
This could be explained by the fact that the agricultural expansion during the first
Table 4 Land use area change from 1988 to 2018
1988
2018
Change of area (ha.)
%
(ha.)
(ha.)
Built-up land
533
3,097
2,563.6
480.6
Agricultural land
19,496
57,938
38,441.9
197.2
Sand dunes
15,505
1,3431
−2,073.8
−13.4
Barren land
397,682
35,8530
−39,151.3
−9.8
Water bodies
127
415
288.2
227.1
A. Shalaby and H. S. Khedr
Table 2 Land use area change from 1988 to 2003
1988
2003
Change of area (ha.)
%
(ha.)
(ha.)
Built-up land
533
1,869
1,335.2
250.3
Agricultural land
19,496
33,204
13,707.8
70.3
Sand dunes
15,505
15,955
450.0
2.9
Barren land
397,682
381,991
−15,690.5
−3.9
Water bodies
127
326
199.3
157.1
Table 3 Land use area change from 2003 to 2018
2003
2018
Change of area (ha.)
%
(ha.)
(ha.)
Built-up land
1,869
3,097
1,228.4
65.7
Agricultural land
33,204
57,938
24,734.1
74.5
Sand dunes
15,955
13,431
−2,523.8
−15.8
Barren land
381,991
358,530
−23,460.8
−6.1
Water bodies
326
415
88.9
27.2
C. Overall changes during the period of study from 1988 to 2018
The overall changes in the main LULC classes during the whole period of the
study (1988–2018) as shown in Table 4. The increase of the total area of built-up
land, agricultural land, and water bodies amounted by 2,563.6 ha., 38,441.9 ha. and
288.2 ha. respectively. This increase synchronized with a decrease in the total area of
barren land that amounted by −3,9151.3 ha. as shown in Maps 7 and 8. The annual
rate of built-up land slightly decreased from the first period to the second period from
89 ha/year to 81 ha/year respectively. While the agricultural land annual rate highly
increased from 913.9 ha/year in the first period to 1,648.9 ha/year in the second
period. The water bodies recorded an increasing annual rate in the first period by
13.3 ha/year, but in the second period, it recorded an increasing rate by 5.9 ha/year.
This could be explained by the fact that the agricultural expansion during the first
Table 4 Land use area change from 1988 to 2018
1988
2018
Change of area (ha.)
%
(ha.)
(ha.)
Built-up land
533
3,097
2,563.6
480.6
Agricultural land
19,496
57,938
38,441.9
197.2
Sand dunes
15,505
1,3431
−2,073.8
−13.4
Barren land
397,682
35,8530
−39,151.3
−9.8
Water bodies
127
415
288.2
227.1