

154
A. Shalaby and H. S. Khedr
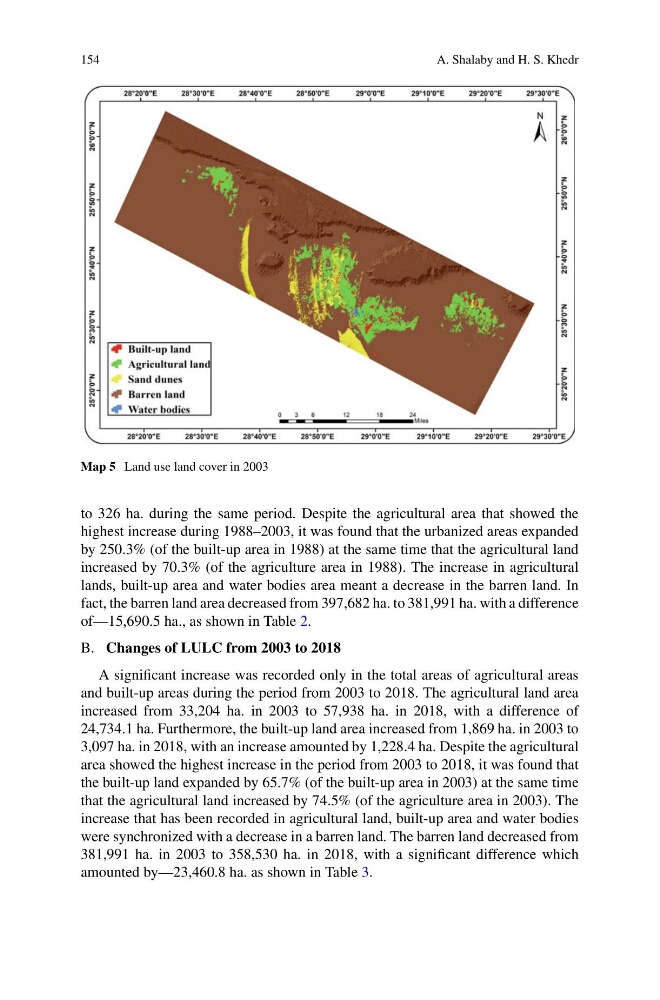
Map 5 Land use land cover in 2003
to 326 ha. during the same period. Despite the agricultural area that showed the
highest increase during 1988–2003, it was found that the urbanized areas expanded
by 250.3% (of the built-up area in 1988) at the same time that the agricultural land
increased by 70.3% (of the agriculture area in 1988). The increase in agricultural
lands, built-up area and water bodies area meant a decrease in the barren land. In
fact, the barren land area decreased from 397,682 ha. to 381,991 ha. with a difference
of—15,690.5 ha., as shown in Table 2.
B. Changes of LULC from 2003 to 2018
A significant increase was recorded only in the total areas of agricultural areas
and built-up areas during the period from 2003 to 2018. The agricultural land area
increased from 33,204 ha. in 2003 to 57,938 ha. in 2018, with a difference of
24,734.1 ha. Furthermore, the built-up land area increased from 1,869 ha. in 2003 to
3,097 ha. in 2018, with an increase amounted by 1,228.4 ha. Despite the agricultural
area showed the highest increase in the period from 2003 to 2018, it was found that
the built-up land expanded by 65.7% (of the built-up area in 2003) at the same time
that the agricultural land increased by 74.5% (of the agriculture area in 2003). The
increase that has been recorded in agricultural land, built-up area and water bodies
were synchronized with a decrease in a barren land. The barren land decreased from
381,991 ha. in 2003 to 358,530 ha. in 2018, with a significant difference which
amounted by—23,460.8 ha. as shown in Table 3.
A. Shalaby and H. S. Khedr
Map 5 Land use land cover in 2003
to 326 ha. during the same period. Despite the agricultural area that showed the
highest increase during 1988–2003, it was found that the urbanized areas expanded
by 250.3% (of the built-up area in 1988) at the same time that the agricultural land
increased by 70.3% (of the agriculture area in 1988). The increase in agricultural
lands, built-up area and water bodies area meant a decrease in the barren land. In
fact, the barren land area decreased from 397,682 ha. to 381,991 ha. with a difference
of—15,690.5 ha., as shown in Table 2.
B. Changes of LULC from 2003 to 2018
A significant increase was recorded only in the total areas of agricultural areas
and built-up areas during the period from 2003 to 2018. The agricultural land area
increased from 33,204 ha. in 2003 to 57,938 ha. in 2018, with a difference of
24,734.1 ha. Furthermore, the built-up land area increased from 1,869 ha. in 2003 to
3,097 ha. in 2018, with an increase amounted by 1,228.4 ha. Despite the agricultural
area showed the highest increase in the period from 2003 to 2018, it was found that
the built-up land expanded by 65.7% (of the built-up area in 2003) at the same time
that the agricultural land increased by 74.5% (of the agriculture area in 2003). The
increase that has been recorded in agricultural land, built-up area and water bodies
were synchronized with a decrease in a barren land. The barren land decreased from
381,991 ha. in 2003 to 358,530 ha. in 2018, with a significant difference which
amounted by—23,460.8 ha. as shown in Table 3.