

Remote Sensing and GIS for Land Use …
153
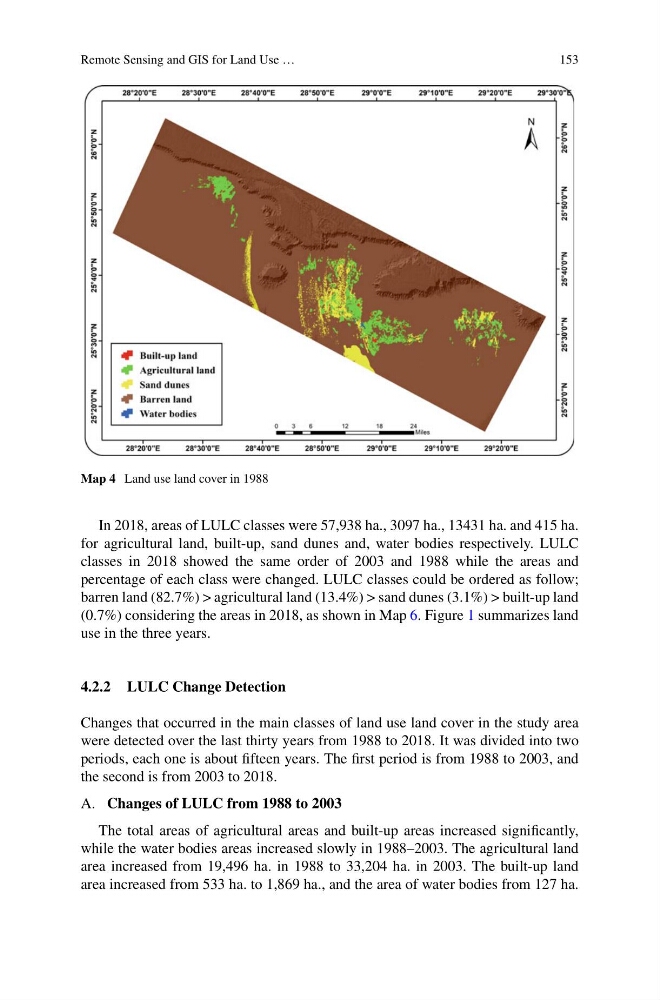
Map 4 Land use land cover in 1988
In 2018, areas of LULC classes were 57,938 ha., 3097 ha., 13431 ha. and 415 ha.
for agricultural land, built-up, sand dunes and, water bodies respectively. LULC
classes in 2018 showed the same order of 2003 and 1988 while the areas and
percentage of each class were changed. LULC classes could be ordered as follow;
barren land (82.7%) > agricultural land (13.4%) > sand dunes (3.1%) > built-up land
(0.7%) considering the areas in 2018, as shown in Map 6. Figure 1 summarizes land
use in the three years.
4.2.2 LULC Change Detection
Changes that occurred in the main classes of land use land cover in the study area
were detected over the last thirty years from 1988 to 2018. It was divided into two
periods, each one is about fifteen years. The first period is from 1988 to 2003, and
the second is from 2003 to 2018.
A. Changes of LULC from 1988 to 2003
The total areas of agricultural areas and built-up areas increased significantly,
while the water bodies areas increased slowly in 1988–2003. The agricultural land
area increased from 19,496 ha. in 1988 to 33,204 ha. in 2003. The built-up land
area increased from 533 ha. to 1,869 ha., and the area of water bodies from 127 ha.
153
Map 4 Land use land cover in 1988
In 2018, areas of LULC classes were 57,938 ha., 3097 ha., 13431 ha. and 415 ha.
for agricultural land, built-up, sand dunes and, water bodies respectively. LULC
classes in 2018 showed the same order of 2003 and 1988 while the areas and
percentage of each class were changed. LULC classes could be ordered as follow;
barren land (82.7%) > agricultural land (13.4%) > sand dunes (3.1%) > built-up land
(0.7%) considering the areas in 2018, as shown in Map 6. Figure 1 summarizes land
use in the three years.
4.2.2 LULC Change Detection
Changes that occurred in the main classes of land use land cover in the study area
were detected over the last thirty years from 1988 to 2018. It was divided into two
periods, each one is about fifteen years. The first period is from 1988 to 2003, and
the second is from 2003 to 2018.
A. Changes of LULC from 1988 to 2003
The total areas of agricultural areas and built-up areas increased significantly,
while the water bodies areas increased slowly in 1988–2003. The agricultural land
area increased from 19,496 ha. in 1988 to 33,204 ha. in 2003. The built-up land
area increased from 533 ha. to 1,869 ha., and the area of water bodies from 127 ha.