

134
A. B. A. Belal et al.
3.9 Footslope
This unit is located at the foot base of the hills, plateau and mountains and is considered a transitional area between the up and low lands (shoulder, back slope). It is
also characterized by the presence of weathering sediments from the surrounding
heights, and it is characterized by hardban subsurface layers
4 Climate Data of Dakhla Oasis
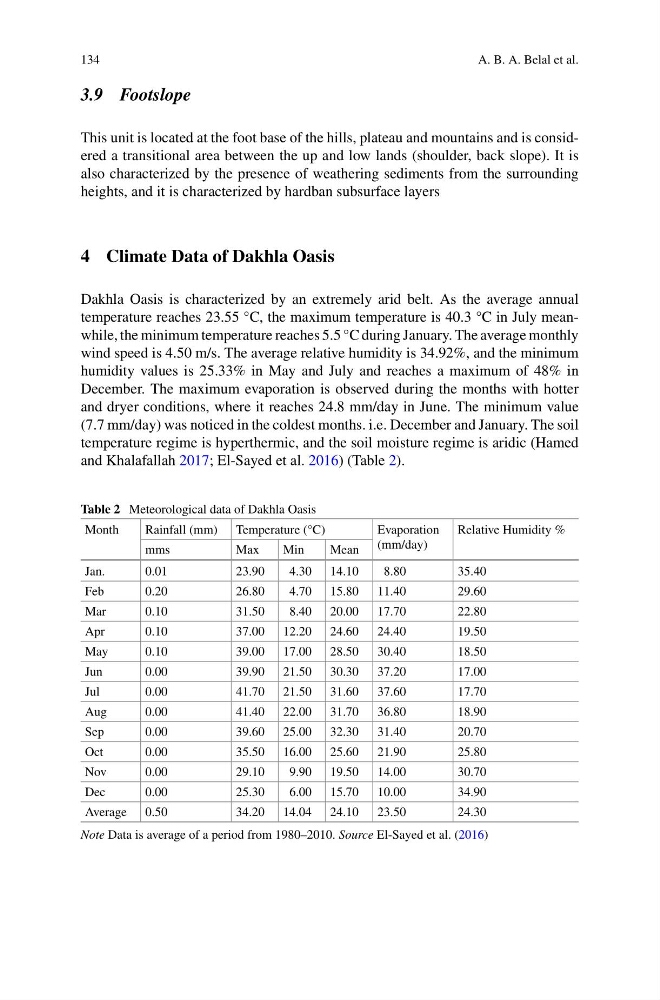
Dakhla Oasis is characterized by an extremely arid belt. As the average annual
temperature reaches 23.55 °C, the maximum temperature is 40.3 °C in July meanwhile, the minimum temperature reaches 5.5 °C during January. The average monthly
wind speed is 4.50 m/s. The average relative humidity is 34.92%, and the minimum
humidity values is 25.33% in May and July and reaches a maximum of 48% in
December. The maximum evaporation is observed during the months with hotter
and dryer conditions, where it reaches 24.8 mm/day in June. The minimum value
(7.7 mm/day) was noticed in the coldest months. i.e. December and January. The soil
temperature regime is hyperthermic, and the soil moisture regime is aridic (Hamed
and Khalafallah 2017; El-Sayed et al. 2016) (Table 2).
Table 2 Meteorological data of Dakhla Oasis
Month
Rainfall (mm) Temperature (°C)
Evaporation
(mm/day)
Relative Humidity %
mms
Max
Min
Mean
Jan.
0.01
23.90
4.30 14.10
8.80
35.40
Feb
0.20
26.80
4.70 15.80 11.40
29.60
Mar
0.10
31.50
8.40 20.00 17.70
22.80
Apr
0.10
37.00 12.20 24.60 24.40
19.50
May
0.10
39.00 17.00 28.50 30.40
18.50
Jun
0.00
39.90 21.50 30.30 37.20
17.00
Jul
0.00
41.70 21.50 31.60 37.60
17.70
Aug
0.00
41.40 22.00 31.70 36.80
18.90
Sep
0.00
39.60 25.00 32.30 31.40
20.70
Oct
0.00
35.50 16.00 25.60 21.90
25.80
Nov
0.00
29.10
9.90 19.50 14.00
30.70
Dec
0.00
25.30
6.00 15.70 10.00
34.90
Average 0.50
34.20 14.04 24.10 23.50
24.30
Note Data is average of a period from 1980–2010. Source El-Sayed et al. (2016)
A. B. A. Belal et al.
3.9 Footslope
This unit is located at the foot base of the hills, plateau and mountains and is considered a transitional area between the up and low lands (shoulder, back slope). It is
also characterized by the presence of weathering sediments from the surrounding
heights, and it is characterized by hardban subsurface layers
4 Climate Data of Dakhla Oasis
Dakhla Oasis is characterized by an extremely arid belt. As the average annual
temperature reaches 23.55 °C, the maximum temperature is 40.3 °C in July meanwhile, the minimum temperature reaches 5.5 °C during January. The average monthly
wind speed is 4.50 m/s. The average relative humidity is 34.92%, and the minimum
humidity values is 25.33% in May and July and reaches a maximum of 48% in
December. The maximum evaporation is observed during the months with hotter
and dryer conditions, where it reaches 24.8 mm/day in June. The minimum value
(7.7 mm/day) was noticed in the coldest months. i.e. December and January. The soil
temperature regime is hyperthermic, and the soil moisture regime is aridic (Hamed
and Khalafallah 2017; El-Sayed et al. 2016) (Table 2).
Table 2 Meteorological data of Dakhla Oasis
Month
Rainfall (mm) Temperature (°C)
Evaporation
(mm/day)
Relative Humidity %
mms
Max
Min
Mean
Jan.
0.01
23.90
4.30 14.10
8.80
35.40
Feb
0.20
26.80
4.70 15.80 11.40
29.60
Mar
0.10
31.50
8.40 20.00 17.70
22.80
Apr
0.10
37.00 12.20 24.60 24.40
19.50
May
0.10
39.00 17.00 28.50 30.40
18.50
Jun
0.00
39.90 21.50 30.30 37.20
17.00
Jul
0.00
41.70 21.50 31.60 37.60
17.70
Aug
0.00
41.40 22.00 31.70 36.80
18.90
Sep
0.00
39.60 25.00 32.30 31.40
20.70
Oct
0.00
35.50 16.00 25.60 21.90
25.80
Nov
0.00
29.10
9.90 19.50 14.00
30.70
Dec
0.00
25.30
6.00 15.70 10.00
34.90
Average 0.50
34.20 14.04 24.10 23.50
24.30
Note Data is average of a period from 1980–2010. Source El-Sayed et al. (2016)