

Aeolian Sand Transport Potential and Its …
117
and Farafra Depressions belong to the group of high energy wind environments
according to the energy classification of surface winds in the arid regions (Fryberger
1979).
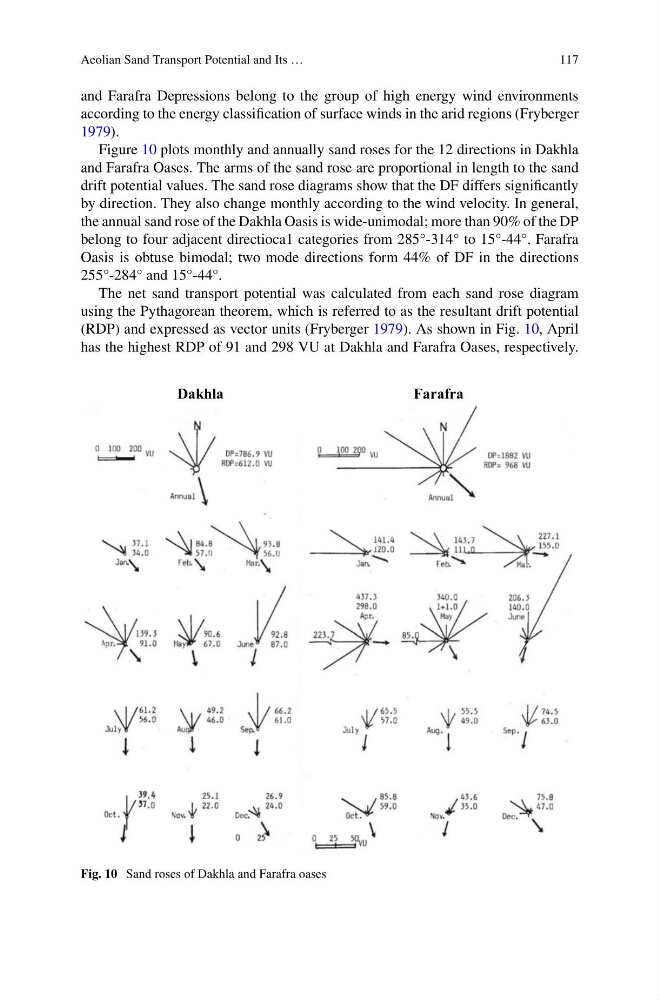
Figure 10 plots monthly and annually sand roses for the 12 directions in Dakhla
and Farafra Oases. The arms of the sand rose are proportional in length to the sand
drift potential values. The sand rose diagrams show that the DF differs significantly
by direction. They also change monthly according to the wind velocity. In general,
the annual sand rose of the Dakhla Oasis is wide-unimodal; more than 90% of the DP
belong to four adjacent directioca1 categories from 285°-314° to 15°-44°. Farafra
Oasis is obtuse bimodal; two mode directions form 44% of DF in the directions
255°-284° and 15°-44°.
The net sand transport potential was calculated from each sand rose diagram
using the Pythagorean theorem, which is referred to as the resultant drift potential
(RDP) and expressed as vector units (Fryberger 1979). As shown in Fig. 10, April
has the highest RDP of 91 and 298 VU at Dakhla and Farafra Oases, respectively.
Dakhla
Farafra
Fig. 10 Sand roses of Dakhla and Farafra oases
117
and Farafra Depressions belong to the group of high energy wind environments
according to the energy classification of surface winds in the arid regions (Fryberger
1979).
Figure 10 plots monthly and annually sand roses for the 12 directions in Dakhla
and Farafra Oases. The arms of the sand rose are proportional in length to the sand
drift potential values. The sand rose diagrams show that the DF differs significantly
by direction. They also change monthly according to the wind velocity. In general,
the annual sand rose of the Dakhla Oasis is wide-unimodal; more than 90% of the DP
belong to four adjacent directioca1 categories from 285°-314° to 15°-44°. Farafra
Oasis is obtuse bimodal; two mode directions form 44% of DF in the directions
255°-284° and 15°-44°.
The net sand transport potential was calculated from each sand rose diagram
using the Pythagorean theorem, which is referred to as the resultant drift potential
(RDP) and expressed as vector units (Fryberger 1979). As shown in Fig. 10, April
has the highest RDP of 91 and 298 VU at Dakhla and Farafra Oases, respectively.
Dakhla
Farafra
Fig. 10 Sand roses of Dakhla and Farafra oases