

18 Perfluorooctanesulfonate (PFOS), Its Occurrence, Fate …
421
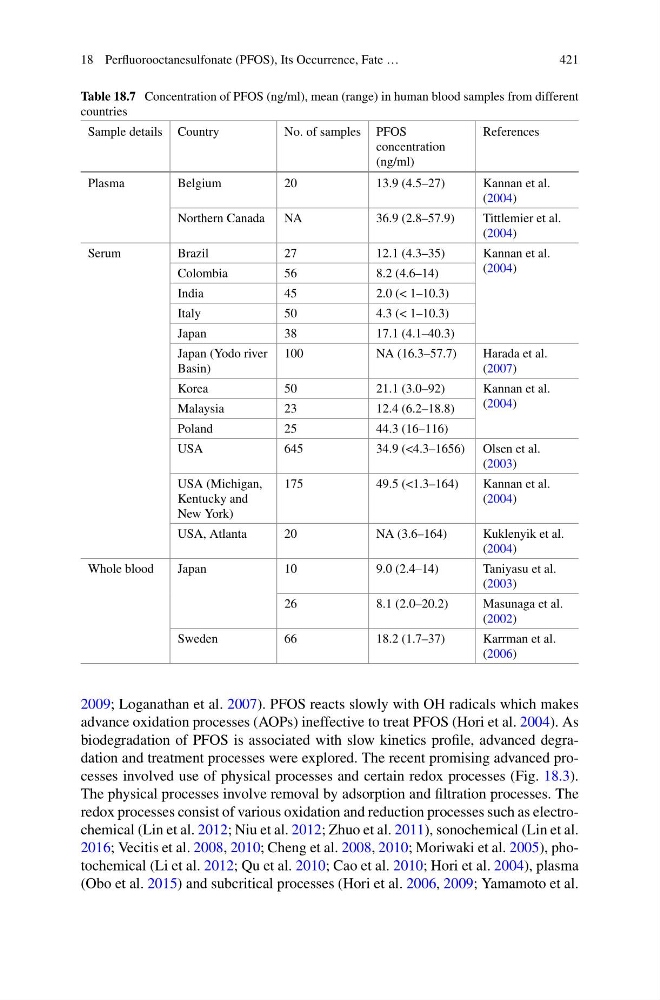
Table 18.7 Concentration of PFOS (ng/ml), mean (range) in human blood samples from different
countries
Sample details Country
No. of samples PFOS
concentration
(ng/ml)
References
Plasma
Belgium
20
13.9 (4.5–27)
Kannan et al.
(2004)
Northern Canada
NA
36.9 (2.8–57.9)
Tittlemier et al.
(2004)
Serum
Brazil
27
12.1 (4.3–35)
Kannan et al.
(2004)
Colombia
56
8.2 (4.6–14)
India
45
2.0 (< 1–10.3)
Italy
50
4.3 (< 1–10.3)
Japan
38
17.1 (4.1–40.3)
Japan (Yodo river
Basin)
100
NA (16.3–57.7)
Harada et al.
(2007)
Korea
50
21.1 (3.0–92)
Kannan et al.
(2004)
Malaysia
23
12.4 (6.2–18.8)
Poland
25
44.3 (16–116)
USA
645
34.9 (<4.3–1656) Olsen et al.
(2003)
USA (Michigan,
Kentucky and
New York)
175
49.5 (<1.3–164)
Kannan et al.
(2004)
USA, Atlanta
20
NA (3.6–164)
Kuklenyik et al.
(2004)
Whole blood
Japan
10
9.0 (2.4–14)
Taniyasu et al.
(2003)
26
8.1 (2.0–20.2)
Masunaga et al.
(2002)
Sweden
66
18.2 (1.7–37)
Karrman et al.
(2006)
2009; Loganathan et al. 2007). PFOS reacts slowly with OH radicals which makes
advance oxidation processes (AOPs) ineffective to treat PFOS (Hori et al. 2004). As
biodegradation of PFOS is associated with slow kinetics profile, advanced degradation and treatment processes were explored. The recent promising advanced processes involved use of physical processes and certain redox processes (Fig. 18.3).
The physical processes involve removal by adsorption and filtration processes. The
redox processes consist of various oxidation and reduction processes such as electrochemical (Lin et al. 2012; Niu et al. 2012; Zhuo et al. 2011), sonochemical (Lin et al.
2016; Vecitis et al. 2008, 2010; Cheng et al. 2008, 2010; Moriwaki et al. 2005), photochemical (Li et al. 2012; Qu et al. 2010; Cao et al. 2010; Hori et al. 2004), plasma
(Obo et al. 2015) and subcritical processes (Hori et al. 2006, 2009; Yamamoto et al.
421
Table 18.7 Concentration of PFOS (ng/ml), mean (range) in human blood samples from different
countries
Sample details Country
No. of samples PFOS
concentration
(ng/ml)
References
Plasma
Belgium
20
13.9 (4.5–27)
Kannan et al.
(2004)
Northern Canada
NA
36.9 (2.8–57.9)
Tittlemier et al.
(2004)
Serum
Brazil
27
12.1 (4.3–35)
Kannan et al.
(2004)
Colombia
56
8.2 (4.6–14)
India
45
2.0 (< 1–10.3)
Italy
50
4.3 (< 1–10.3)
Japan
38
17.1 (4.1–40.3)
Japan (Yodo river
Basin)
100
NA (16.3–57.7)
Harada et al.
(2007)
Korea
50
21.1 (3.0–92)
Kannan et al.
(2004)
Malaysia
23
12.4 (6.2–18.8)
Poland
25
44.3 (16–116)
USA
645
34.9 (<4.3–1656) Olsen et al.
(2003)
USA (Michigan,
Kentucky and
New York)
175
49.5 (<1.3–164)
Kannan et al.
(2004)
USA, Atlanta
20
NA (3.6–164)
Kuklenyik et al.
(2004)
Whole blood
Japan
10
9.0 (2.4–14)
Taniyasu et al.
(2003)
26
8.1 (2.0–20.2)
Masunaga et al.
(2002)
Sweden
66
18.2 (1.7–37)
Karrman et al.
(2006)
2009; Loganathan et al. 2007). PFOS reacts slowly with OH radicals which makes
advance oxidation processes (AOPs) ineffective to treat PFOS (Hori et al. 2004). As
biodegradation of PFOS is associated with slow kinetics profile, advanced degradation and treatment processes were explored. The recent promising advanced processes involved use of physical processes and certain redox processes (Fig. 18.3).
The physical processes involve removal by adsorption and filtration processes. The
redox processes consist of various oxidation and reduction processes such as electrochemical (Lin et al. 2012; Niu et al. 2012; Zhuo et al. 2011), sonochemical (Lin et al.
2016; Vecitis et al. 2008, 2010; Cheng et al. 2008, 2010; Moriwaki et al. 2005), photochemical (Li et al. 2012; Qu et al. 2010; Cao et al. 2010; Hori et al. 2004), plasma
(Obo et al. 2015) and subcritical processes (Hori et al. 2006, 2009; Yamamoto et al.