

18 Perfluorooctanesulfonate (PFOS), Its Occurrence, Fate …
417
Table 18.5 (continued)
Country
Location/description PFOS concentration
References
Influent
(ng/L)
Effluent
(ng/L)
Sludge
(ng/g dw)
Switzerland Bellinzona and
Geneva
–
–
49–130
Alder and
van der
Voet (2015)
WWTPs of the Glatt
Valley
18–449
16–303
–
Huset et al.
(2008)
Zurich (Digested
sludge)
–
–
20–600
Sun et al.
(2011)
Taiwan
Hsinchu
175–216.7
162.7–264.7 –
Lin et al.
(2010)
Thailand
Central Thailand
465.4
190.1
82.3
Kunacheva
et al.
(2011)
Eastern Thailand
381.3
552.8
683.7
USA
10 WWTPs
1.0–429
0.5–141
–
Schultz
et al.
(2006)
California (4
WWTPs)
–
20–187
–
Plumlee
et al.
(2008)
Georgia
2.5–7.9
1.80–13
22–70
Loganathan
et al.
(2007)
Kentucky
7.0–16
8–28
133–993
Lowa
–
26.0
–
Boulanger
et al.
(2005)
New York (6
WWTPs)
–
3–68
<10–65
Sinclair
and Kannan
(2006)
efficiency in conventional WWTPs with biological treatments is very low or negligible, and sometimes it gives negative removal efficiency (Campo et al. 2014; Guerra
et al. 2014; Arvaniti et al. 2012; Thompson et al. 2011c; Yu et al. 2009; Loganathan
et al. 2007). Hence, WWTPs are also referred as point sources for releasing PFOS in
surface water streams (Lam et al. 2016; Sun et al. 2011; Möller et al. 2010; Ahrens
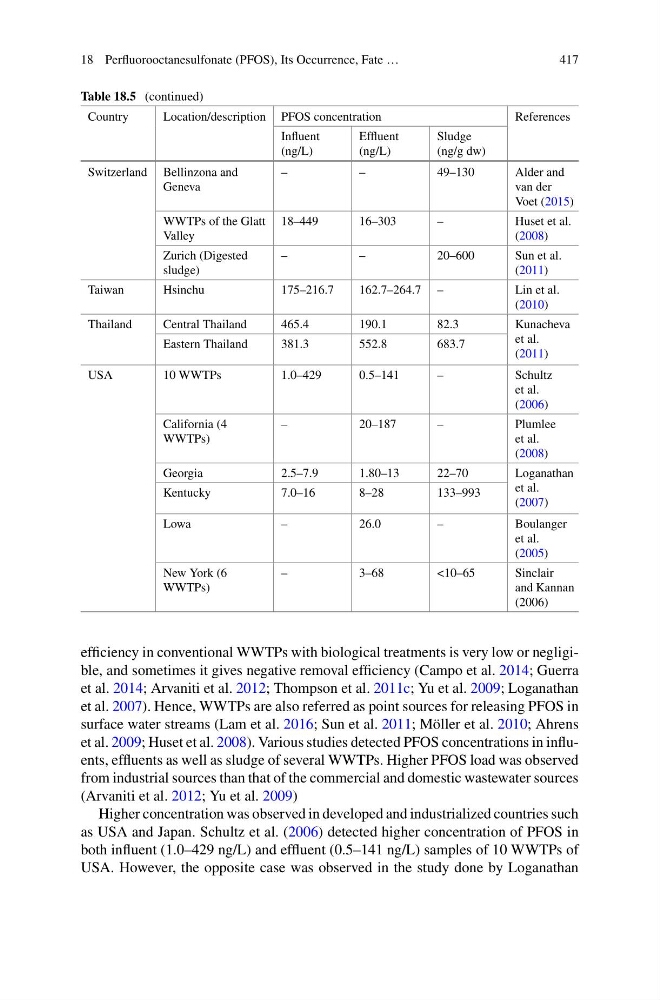
et al. 2009; Huset et al. 2008). Various studies detected PFOS concentrations in influents, effluents as well as sludge of several WWTPs. Higher PFOS load was observed
from industrial sources than that of the commercial and domestic wastewater sources
(Arvaniti et al. 2012; Yu et al. 2009)
Higher concentration was observed in developed and industrialized countries such
as USA and Japan. Schultz et al. (2006) detected higher concentration of PFOS in
both influent (1.0–429 ng/L) and effluent (0.5–141 ng/L) samples of 10 WWTPs of
USA. However, the opposite case was observed in the study done by Loganathan
417
Table 18.5 (continued)
Country
Location/description PFOS concentration
References
Influent
(ng/L)
Effluent
(ng/L)
Sludge
(ng/g dw)
Switzerland Bellinzona and
Geneva
–
–
49–130
Alder and
van der
Voet (2015)
WWTPs of the Glatt
Valley
18–449
16–303
–
Huset et al.
(2008)
Zurich (Digested
sludge)
–
–
20–600
Sun et al.
(2011)
Taiwan
Hsinchu
175–216.7
162.7–264.7 –
Lin et al.
(2010)
Thailand
Central Thailand
465.4
190.1
82.3
Kunacheva
et al.
(2011)
Eastern Thailand
381.3
552.8
683.7
USA
10 WWTPs
1.0–429
0.5–141
–
Schultz
et al.
(2006)
California (4
WWTPs)
–
20–187
–
Plumlee
et al.
(2008)
Georgia
2.5–7.9
1.80–13
22–70
Loganathan
et al.
(2007)
Kentucky
7.0–16
8–28
133–993
Lowa
–
26.0
–
Boulanger
et al.
(2005)
New York (6
WWTPs)
–
3–68
<10–65
Sinclair
and Kannan
(2006)
efficiency in conventional WWTPs with biological treatments is very low or negligible, and sometimes it gives negative removal efficiency (Campo et al. 2014; Guerra
et al. 2014; Arvaniti et al. 2012; Thompson et al. 2011c; Yu et al. 2009; Loganathan
et al. 2007). Hence, WWTPs are also referred as point sources for releasing PFOS in
surface water streams (Lam et al. 2016; Sun et al. 2011; Möller et al. 2010; Ahrens
et al. 2009; Huset et al. 2008). Various studies detected PFOS concentrations in influents, effluents as well as sludge of several WWTPs. Higher PFOS load was observed
from industrial sources than that of the commercial and domestic wastewater sources
(Arvaniti et al. 2012; Yu et al. 2009)
Higher concentration was observed in developed and industrialized countries such
as USA and Japan. Schultz et al. (2006) detected higher concentration of PFOS in
both influent (1.0–429 ng/L) and effluent (0.5–141 ng/L) samples of 10 WWTPs of
USA. However, the opposite case was observed in the study done by Loganathan