

8 Reappraisal of Permeable Reactive Barrier as a Sustainable …
199
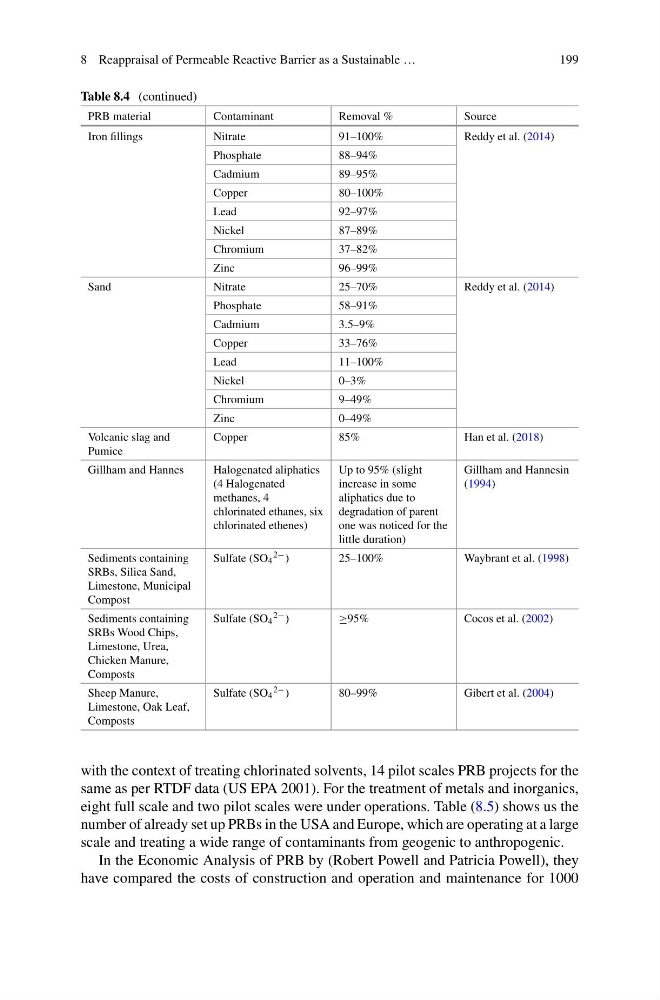
Table 8.4 (continued)
PRB material
Contaminant
Removal %
Source
Iron fillings
Nitrate
91–100%
Reddy et al. (2014)
Phosphate
88–94%
Cadmium
89–95%
Copper
80–100%
Lead
92–97%
Nickel
87–89%
Chromium
37–82%
Zinc
96–99%
Sand
Nitrate
25–70%
Reddy et al. (2014)
Phosphate
58–91%
Cadmium
3.5–9%
Copper
33–76%
Lead
11–100%
Nickel
0–3%
Chromium
9–49%
Zinc
0–49%
Volcanic slag and
Pumice
Copper
85%
Han et al. (2018)
Gillham and Hannes
Halogenated aliphatics
(4 Halogenated
methanes, 4
chlorinated ethanes, six
chlorinated ethenes)
Up to 95% (slight
increase in some
aliphatics due to
degradation of parent
one was noticed for the
little duration)
Gillham and Hannesin
(1994)
Sediments containing
SRBs, Silica Sand,
Limestone, Municipal
Compost
Sulfate (SO 4
2− )
25–100%
Waybrant et al. (1998)
Sediments containing
SRBs Wood Chips,
Limestone, Urea,
Chicken Manure,
Composts
Sulfate (SO 4
2− )
≥95%
Cocos et al. (2002)
Sheep Manure,
Limestone, Oak Leaf,
Composts
Sulfate (SO 4
2− )
80–99%
Gibert et al. (2004)
with the context of treating chlorinated solvents, 14 pilot scales PRB projects for the
same as per RTDF data (US EPA 2001). For the treatment of metals and inorganics,
eight full scale and two pilot scales were under operations. Table (8.5) shows us the
number of already set up PRBs in the USA and Europe, which are operating at a large
scale and treating a wide range of contaminants from geogenic to anthropogenic.
In the Economic Analysis of PRB by (Robert Powell and Patricia Powell), they
have compared the costs of construction and operation and maintenance for 1000
199
Table 8.4 (continued)
PRB material
Contaminant
Removal %
Source
Iron fillings
Nitrate
91–100%
Reddy et al. (2014)
Phosphate
88–94%
Cadmium
89–95%
Copper
80–100%
Lead
92–97%
Nickel
87–89%
Chromium
37–82%
Zinc
96–99%
Sand
Nitrate
25–70%
Reddy et al. (2014)
Phosphate
58–91%
Cadmium
3.5–9%
Copper
33–76%
Lead
11–100%
Nickel
0–3%
Chromium
9–49%
Zinc
0–49%
Volcanic slag and
Pumice
Copper
85%
Han et al. (2018)
Gillham and Hannes
Halogenated aliphatics
(4 Halogenated
methanes, 4
chlorinated ethanes, six
chlorinated ethenes)
Up to 95% (slight
increase in some
aliphatics due to
degradation of parent
one was noticed for the
little duration)
Gillham and Hannesin
(1994)
Sediments containing
SRBs, Silica Sand,
Limestone, Municipal
Compost
Sulfate (SO 4
2− )
25–100%
Waybrant et al. (1998)
Sediments containing
SRBs Wood Chips,
Limestone, Urea,
Chicken Manure,
Composts
Sulfate (SO 4
2− )
≥95%
Cocos et al. (2002)
Sheep Manure,
Limestone, Oak Leaf,
Composts
Sulfate (SO 4
2− )
80–99%
Gibert et al. (2004)
with the context of treating chlorinated solvents, 14 pilot scales PRB projects for the
same as per RTDF data (US EPA 2001). For the treatment of metals and inorganics,
eight full scale and two pilot scales were under operations. Table (8.5) shows us the
number of already set up PRBs in the USA and Europe, which are operating at a large
scale and treating a wide range of contaminants from geogenic to anthropogenic.
In the Economic Analysis of PRB by (Robert Powell and Patricia Powell), they
have compared the costs of construction and operation and maintenance for 1000