

3 New Trends and Drivers for Agricultural Land Use in Germany
47
0
2
4
6
8
10
12
14
2009
2011
2013
2015
2017
2.3
2.2
2.2
2.2
2.4
4.5
4.4
4.4
4.3
4.4
6.3
5.8
5
4.8
4.7
HNV I
HNV II
Year
%
HNV III
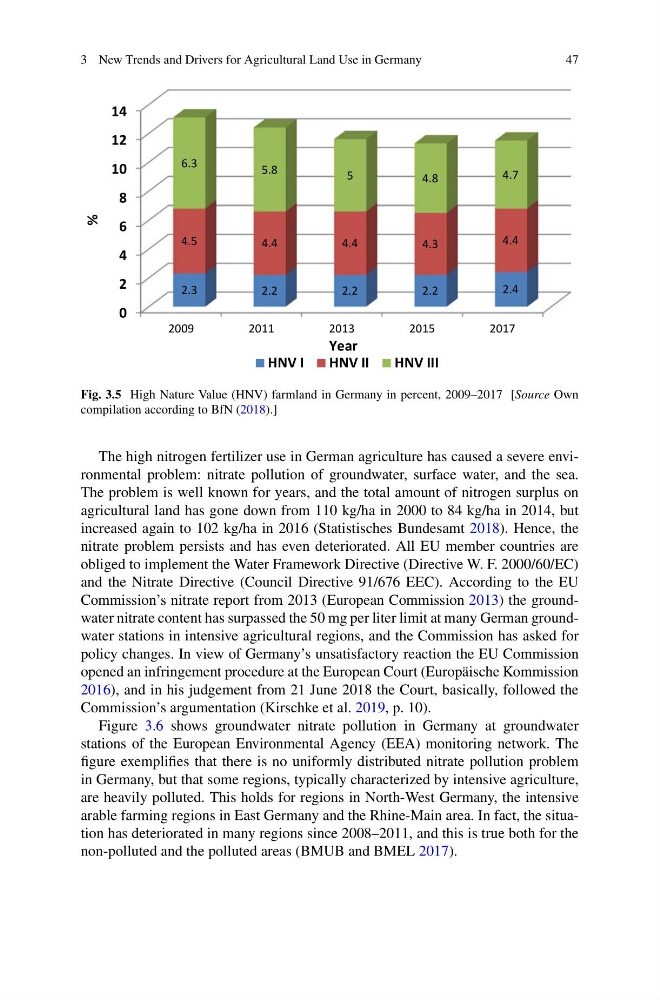
Fig. 3.5 High Nature Value (HNV) farmland in Germany in percent, 2009–2017 [Source Own
compilation according to BfN (2018).]
The high nitrogen fertilizer use in German agriculture has caused a severe environmental problem: nitrate pollution of groundwater, surface water, and the sea.
The problem is well known for years, and the total amount of nitrogen surplus on
agricultural land has gone down from 110 kg/ha in 2000 to 84 kg/ha in 2014, but
increased again to 102 kg/ha in 2016 (Statistisches Bundesamt 2018). Hence, the
nitrate problem persists and has even deteriorated. All EU member countries are
obliged to implement the Water Framework Directive (Directive W. F. 2000/60/EC)
and the Nitrate Directive (Council Directive 91/676 EEC). According to the EU
Commission’s nitrate report from 2013 (European Commission 2013) the groundwater nitrate content has surpassed the 50 mg per liter limit at many German groundwater stations in intensive agricultural regions, and the Commission has asked for
policy changes. In view of Germany’s unsatisfactory reaction the EU Commission
opened an infringement procedure at the European Court (Europäische Kommission
2016), and in his judgement from 21 June 2018 the Court, basically, followed the
Commission’s argumentation (Kirschke et al. 2019, p. 10).
Figure 3.6 shows groundwater nitrate pollution in Germany at groundwater
stations of the European Environmental Agency (EEA) monitoring network. The
figure exemplifies that there is no uniformly distributed nitrate pollution problem
in Germany, but that some regions, typically characterized by intensive agriculture,
are heavily polluted. This holds for regions in North-West Germany, the intensive
arable farming regions in East Germany and the Rhine-Main area. In fact, the situation has deteriorated in many regions since 2008–2011, and this is true both for the
non-polluted and the polluted areas (BMUB and BMEL 2017).
47
0
2
4
6
8
10
12
14
2009
2011
2013
2015
2017
2.3
2.2
2.2
2.2
2.4
4.5
4.4
4.4
4.3
4.4
6.3
5.8
5
4.8
4.7
HNV I
HNV II
Year
%
HNV III
Fig. 3.5 High Nature Value (HNV) farmland in Germany in percent, 2009–2017 [Source Own
compilation according to BfN (2018).]
The high nitrogen fertilizer use in German agriculture has caused a severe environmental problem: nitrate pollution of groundwater, surface water, and the sea.
The problem is well known for years, and the total amount of nitrogen surplus on
agricultural land has gone down from 110 kg/ha in 2000 to 84 kg/ha in 2014, but
increased again to 102 kg/ha in 2016 (Statistisches Bundesamt 2018). Hence, the
nitrate problem persists and has even deteriorated. All EU member countries are
obliged to implement the Water Framework Directive (Directive W. F. 2000/60/EC)
and the Nitrate Directive (Council Directive 91/676 EEC). According to the EU
Commission’s nitrate report from 2013 (European Commission 2013) the groundwater nitrate content has surpassed the 50 mg per liter limit at many German groundwater stations in intensive agricultural regions, and the Commission has asked for
policy changes. In view of Germany’s unsatisfactory reaction the EU Commission
opened an infringement procedure at the European Court (Europäische Kommission
2016), and in his judgement from 21 June 2018 the Court, basically, followed the
Commission’s argumentation (Kirschke et al. 2019, p. 10).
Figure 3.6 shows groundwater nitrate pollution in Germany at groundwater
stations of the European Environmental Agency (EEA) monitoring network. The
figure exemplifies that there is no uniformly distributed nitrate pollution problem
in Germany, but that some regions, typically characterized by intensive agriculture,
are heavily polluted. This holds for regions in North-West Germany, the intensive
arable farming regions in East Germany and the Rhine-Main area. In fact, the situation has deteriorated in many regions since 2008–2011, and this is true both for the
non-polluted and the polluted areas (BMUB and BMEL 2017).