

49
tion was considerable. Relatively larger values were mainly distributed in the South
Kazakhstan, as well as Almaty, Petropavl, Zhambyl, Akmola, and the East
Kazakhstan regions. Rainfall erosivity in Kostanay, Pavlodar, West Kazakhstan,
Aktobe, and Karagandy is at the middle level, and that of Atyrau, Mangystau, and
Kyzyl-Orda is at the lower level. From east to west, rainfall erosivity has declined
overall.
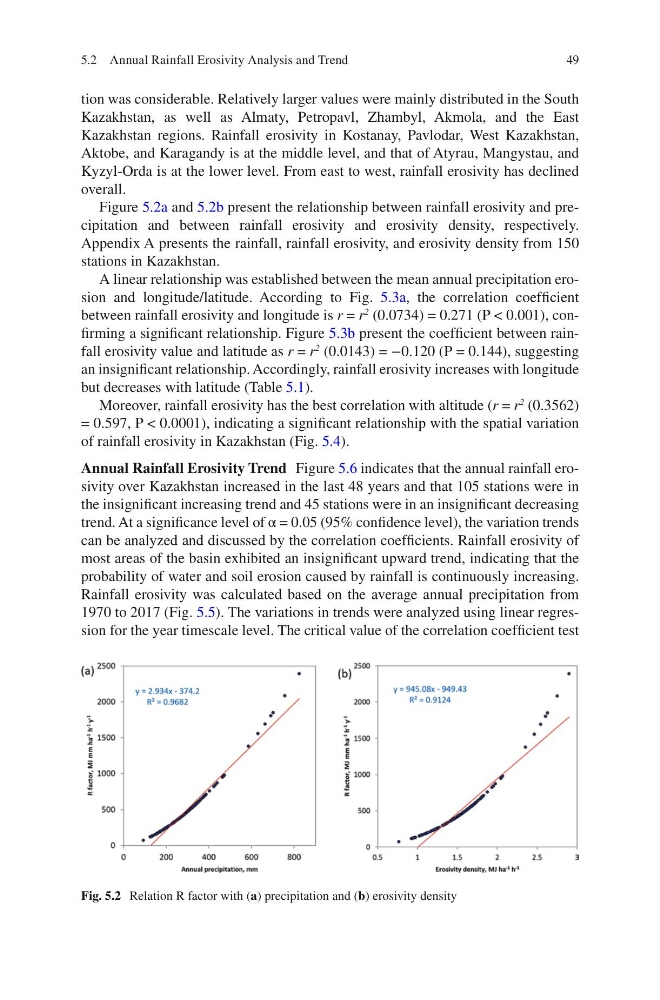
Figure 5.2a and 5.2b present the relationship between rainfall erosivity and precipitation and between rainfall erosivity and erosivity density, respectively.
Appendix A presents the rainfall, rainfall erosivity, and erosivity density from 150
stations in Kazakhstan.
A linear relationship was established between the mean annual precipitation erosion and longitude/latitude. According to Fig. 5.3a, the correlation coefficient
between rainfall erosivity and longitude is r = r
2
(0.0734) = 0.271 (P < 0.001), confirming a significant relationship. Figure 5.3b present the coefficient between rainfall erosivity value and latitude as r = r
2
(0.0143) = −0.120 (P = 0.144), suggesting
an insignificant relationship. Accordingly, rainfall erosivity increases with longitude
but decreases with latitude (Table 5.1).
Moreover, rainfall erosivity has the best correlation with altitude (r = r
2
(0.3562)
= 0.597, P < 0.0001), indicating a significant relationship with the spatial variation
of rainfall erosivity in Kazakhstan (Fig. 5.4).
Annual Rainfall Erosivity Trend Figure 5.6 indicates that the annual rainfall erosivity over Kazakhstan increased in the last 48 years and that 105 stations were in
the insignificant increasing trend and 45 stations were in an insignificant decreasing
trend. At a significance level of α = 0.05 (95% confidence level), the variation trends
can be analyzed and discussed by the correlation coefficients. Rainfall erosivity of
most areas of the basin exhibited an insignificant upward trend, indicating that the
probability of water and soil erosion caused by rainfall is continuously increasing.
Rainfall erosivity was calculated based on the average annual precipitation from
1970 to 2017 (Fig. 5.5). The variations in trends were analyzed using linear regression for the year timescale level. The critical value of the correlation coefficient test
Fig. 5.2 Relation R factor with (a) precipitation and (b) erosivity density
5.2 Annual Rainfall Erosivity Analysis and Trend
tion was considerable. Relatively larger values were mainly distributed in the South
Kazakhstan, as well as Almaty, Petropavl, Zhambyl, Akmola, and the East
Kazakhstan regions. Rainfall erosivity in Kostanay, Pavlodar, West Kazakhstan,
Aktobe, and Karagandy is at the middle level, and that of Atyrau, Mangystau, and
Kyzyl-Orda is at the lower level. From east to west, rainfall erosivity has declined
overall.
Figure 5.2a and 5.2b present the relationship between rainfall erosivity and precipitation and between rainfall erosivity and erosivity density, respectively.
Appendix A presents the rainfall, rainfall erosivity, and erosivity density from 150
stations in Kazakhstan.
A linear relationship was established between the mean annual precipitation erosion and longitude/latitude. According to Fig. 5.3a, the correlation coefficient
between rainfall erosivity and longitude is r = r
2
(0.0734) = 0.271 (P < 0.001), confirming a significant relationship. Figure 5.3b present the coefficient between rainfall erosivity value and latitude as r = r
2
(0.0143) = −0.120 (P = 0.144), suggesting
an insignificant relationship. Accordingly, rainfall erosivity increases with longitude
but decreases with latitude (Table 5.1).
Moreover, rainfall erosivity has the best correlation with altitude (r = r
2
(0.3562)
= 0.597, P < 0.0001), indicating a significant relationship with the spatial variation
of rainfall erosivity in Kazakhstan (Fig. 5.4).
Annual Rainfall Erosivity Trend Figure 5.6 indicates that the annual rainfall erosivity over Kazakhstan increased in the last 48 years and that 105 stations were in
the insignificant increasing trend and 45 stations were in an insignificant decreasing
trend. At a significance level of α = 0.05 (95% confidence level), the variation trends
can be analyzed and discussed by the correlation coefficients. Rainfall erosivity of
most areas of the basin exhibited an insignificant upward trend, indicating that the
probability of water and soil erosion caused by rainfall is continuously increasing.
Rainfall erosivity was calculated based on the average annual precipitation from
1970 to 2017 (Fig. 5.5). The variations in trends were analyzed using linear regression for the year timescale level. The critical value of the correlation coefficient test
Fig. 5.2 Relation R factor with (a) precipitation and (b) erosivity density
5.2 Annual Rainfall Erosivity Analysis and Trend