

36
spatial change in potential annual soil erosion and absolute differences in Central
Asia, which is estimated by the RUSLE model in various projected climatic scenarios. These increases in annual soil loss may be due to a blend of several factors. Of
note, however, is that changes in rainfall erosivity often occur because of changes in
annual rainfall. The results of the average changes in soil loss (Table 4.5) in the historical and projected climate change predictions from four various climate models for
the two different periods are 2.72 t ha
−1
year
−1
(2030s) and 2.71 t ha
−1
year
−1
(2070s).
The annual soil erosion shows a corresponding increase of about 20.82% from
the baseline climate for the same time slice and climate scenario. MPIELSMLR-8.5
also shows a decrease in soil erosion (−1.47%), even though the erosivity is reported
to be high. For the 2020 to 2039 climatic period, MIROC5-2.6 and MIROC5-8.5
show the highest positive percentage increases, in soil erosion, of about 12.02% and
20.23% respectively. As rainfall erosivity increases from the baseline erosion, the
percentage of changes in annual erosion show increases.
The dynamic influence of climate change on soil erosion is another essential factor that is uncertain; however, it may depend on the interacting effects of the associated factors. Yet, in the climate change-based soil erosivity predictions, it can be
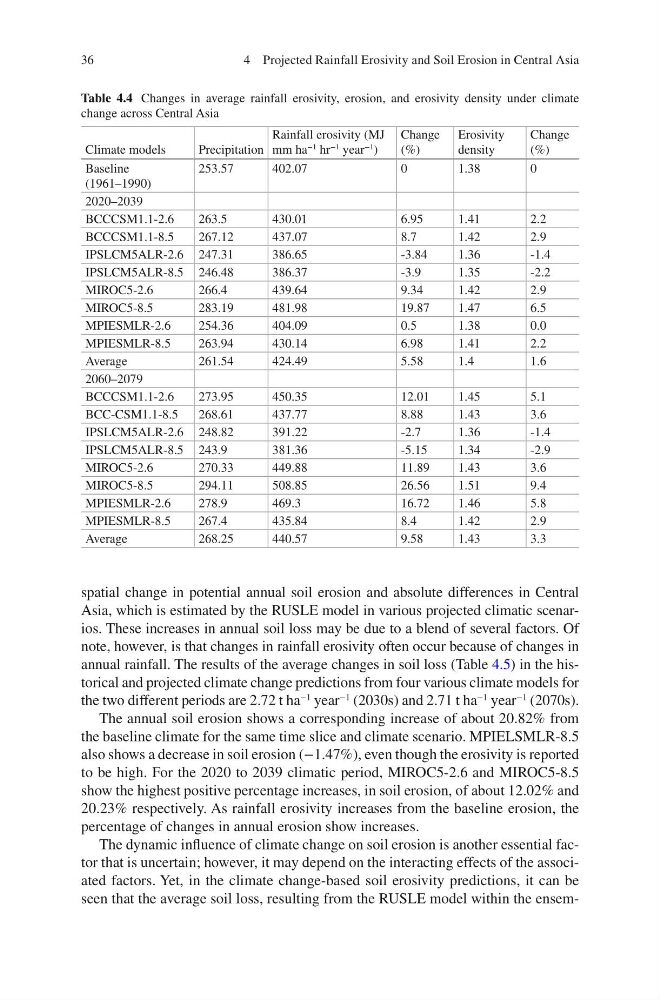
seen that the average soil loss, resulting from the RUSLE model within the ensemTable 4.4 Changes in average rainfall erosivity, erosion, and erosivity density under climate
change across Central Asia
Climate models
Precipitation
Rainfall erosivity (MJ
mm ha
−1 hr
−1 year
−1
)
Change
(%)
Erosivity
density
Change
(%)
Baseline
(1961–1990)
253.57
402.07
0
1.38
0
2020–2039
BCCCSM1.1-2.6
263.5
430.01
6.95
1.41
2.2
BCCCSM1.1-8.5
267.12
437.07
8.7
1.42
2.9
IPSLCM5ALR-2.6 247.31
386.65
-3.84
1.36
-1.4
IPSLCM5ALR-8.5 246.48
386.37
-3.9
1.35
-2.2
MIROC5-2.6
266.4
439.64
9.34
1.42
2.9
MIROC5-8.5
283.19
481.98
19.87
1.47
6.5
MPIESMLR-2.6
254.36
404.09
0.5
1.38
0.0
MPIESMLR-8.5
263.94
430.14
6.98
1.41
2.2
Average
261.54
424.49
5.58
1.4
1.6
2060–2079
BCCCSM1.1-2.6
273.95
450.35
12.01
1.45
5.1
BCC-CSM1.1-8.5
268.61
437.77
8.88
1.43
3.6
IPSLCM5ALR-2.6 248.82
391.22
-2.7
1.36
-1.4
IPSLCM5ALR-8.5 243.9
381.36
-5.15
1.34
-2.9
MIROC5-2.6
270.33
449.88
11.89
1.43
3.6
MIROC5-8.5
294.11
508.85
26.56
1.51
9.4
MPIESMLR-2.6
278.9
469.3
16.72
1.46
5.8
MPIESMLR-8.5
267.4
435.84
8.4
1.42
2.9
Average
268.25
440.57
9.58
1.43
3.3
4 Projected Rainfall Erosivity and Soil Erosion in Central Asia
spatial change in potential annual soil erosion and absolute differences in Central
Asia, which is estimated by the RUSLE model in various projected climatic scenarios. These increases in annual soil loss may be due to a blend of several factors. Of
note, however, is that changes in rainfall erosivity often occur because of changes in
annual rainfall. The results of the average changes in soil loss (Table 4.5) in the historical and projected climate change predictions from four various climate models for
the two different periods are 2.72 t ha
−1
year
−1
(2030s) and 2.71 t ha
−1
year
−1
(2070s).
The annual soil erosion shows a corresponding increase of about 20.82% from
the baseline climate for the same time slice and climate scenario. MPIELSMLR-8.5
also shows a decrease in soil erosion (−1.47%), even though the erosivity is reported
to be high. For the 2020 to 2039 climatic period, MIROC5-2.6 and MIROC5-8.5
show the highest positive percentage increases, in soil erosion, of about 12.02% and
20.23% respectively. As rainfall erosivity increases from the baseline erosion, the
percentage of changes in annual erosion show increases.
The dynamic influence of climate change on soil erosion is another essential factor that is uncertain; however, it may depend on the interacting effects of the associated factors. Yet, in the climate change-based soil erosivity predictions, it can be
seen that the average soil loss, resulting from the RUSLE model within the ensemTable 4.4 Changes in average rainfall erosivity, erosion, and erosivity density under climate
change across Central Asia
Climate models
Precipitation
Rainfall erosivity (MJ
mm ha
−1 hr
−1 year
−1
)
Change
(%)
Erosivity
density
Change
(%)
Baseline
(1961–1990)
253.57
402.07
0
1.38
0
2020–2039
BCCCSM1.1-2.6
263.5
430.01
6.95
1.41
2.2
BCCCSM1.1-8.5
267.12
437.07
8.7
1.42
2.9
IPSLCM5ALR-2.6 247.31
386.65
-3.84
1.36
-1.4
IPSLCM5ALR-8.5 246.48
386.37
-3.9
1.35
-2.2
MIROC5-2.6
266.4
439.64
9.34
1.42
2.9
MIROC5-8.5
283.19
481.98
19.87
1.47
6.5
MPIESMLR-2.6
254.36
404.09
0.5
1.38
0.0
MPIESMLR-8.5
263.94
430.14
6.98
1.41
2.2
Average
261.54
424.49
5.58
1.4
1.6
2060–2079
BCCCSM1.1-2.6
273.95
450.35
12.01
1.45
5.1
BCC-CSM1.1-8.5
268.61
437.77
8.88
1.43
3.6
IPSLCM5ALR-2.6 248.82
391.22
-2.7
1.36
-1.4
IPSLCM5ALR-8.5 243.9
381.36
-5.15
1.34
-2.9
MIROC5-2.6
270.33
449.88
11.89
1.43
3.6
MIROC5-8.5
294.11
508.85
26.56
1.51
9.4
MPIESMLR-2.6
278.9
469.3
16.72
1.46
5.8
MPIESMLR-8.5
267.4
435.84
8.4
1.42
2.9
Average
268.25
440.57
9.58
1.43
3.3
4 Projected Rainfall Erosivity and Soil Erosion in Central Asia