

35
4.5 Projected Future Soil Erosion Potential in Central Asia
According to the results of the soil erosion map (Fig. 4.9), most of the study area
had a low risk of erosion in the baseline period. By substituting rainfall erosivity and
taking into account all other constant factors in the RUSLE model, soil erosion was
predicted and calculated for the different GCMs (BCCCSM1.1, IPSLCM5ALR,
MIROC-5, and MPIESMLR) as well as for RCP 2.6 and RCP 8.5). The results of
the above modeling are presented in Fig. 4.9. In Central Asia, increasing soil erosion is reflected by the variations in annual erosivity, which is evident in all scenarios and shows a significant growth trend. However, in the 2030s, BCCCSM1.1-2.6
and BCCCSM1.1-8.5 did not show a significant change. In the 2030s, MIROC5-2.6
and MIROC5-8.5 display the highest percentage of growth in soil loss of about
16.1% and 15.6%, respectively. Despite the high R factor, BCCCSM1.1-8.5 (2070s)
shows a decrease in soil erosion (−13.3%). During this climatic period, the highest
rainfall erosivity is observed at MIROC5-8.5, where the annual soil loss was about
3.33 t ha
−1
year
−1
, which increased from the baseline soil loss by 20.82%.
In general, there is a growth in the average annual soil loss for most model ensembles in both climatic periods (2030s and 2070s). Figures 4.9, 4.10, and 4.11 show the
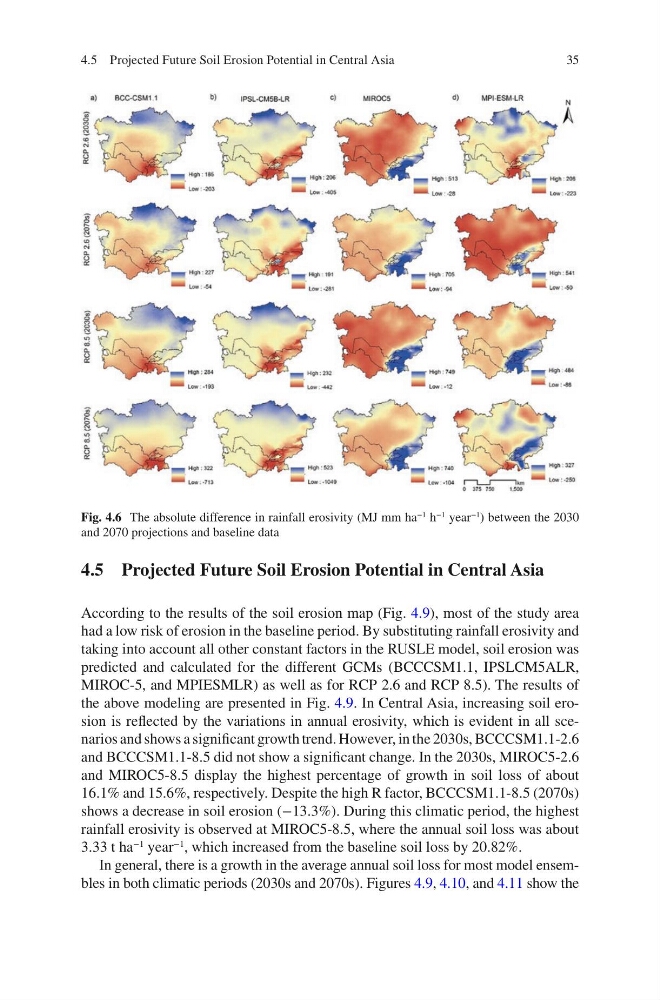
Fig. 4.6 The absolute difference in rainfall erosivity (MJ mm ha
−1 h
−1 year
−1 ) between the 2030
and 2070 projections and baseline data
4.5 Projected Future Soil Erosion Potential in Central Asia
4.5 Projected Future Soil Erosion Potential in Central Asia
According to the results of the soil erosion map (Fig. 4.9), most of the study area
had a low risk of erosion in the baseline period. By substituting rainfall erosivity and
taking into account all other constant factors in the RUSLE model, soil erosion was
predicted and calculated for the different GCMs (BCCCSM1.1, IPSLCM5ALR,
MIROC-5, and MPIESMLR) as well as for RCP 2.6 and RCP 8.5). The results of
the above modeling are presented in Fig. 4.9. In Central Asia, increasing soil erosion is reflected by the variations in annual erosivity, which is evident in all scenarios and shows a significant growth trend. However, in the 2030s, BCCCSM1.1-2.6
and BCCCSM1.1-8.5 did not show a significant change. In the 2030s, MIROC5-2.6
and MIROC5-8.5 display the highest percentage of growth in soil loss of about
16.1% and 15.6%, respectively. Despite the high R factor, BCCCSM1.1-8.5 (2070s)
shows a decrease in soil erosion (−13.3%). During this climatic period, the highest
rainfall erosivity is observed at MIROC5-8.5, where the annual soil loss was about
3.33 t ha
−1
year
−1
, which increased from the baseline soil loss by 20.82%.
In general, there is a growth in the average annual soil loss for most model ensembles in both climatic periods (2030s and 2070s). Figures 4.9, 4.10, and 4.11 show the
Fig. 4.6 The absolute difference in rainfall erosivity (MJ mm ha
−1 h
−1 year
−1 ) between the 2030
and 2070 projections and baseline data
4.5 Projected Future Soil Erosion Potential in Central Asia