

19
for calculating the factors have been tested iteratively, and the optimal equations are
selected based on their suitability for use with the available data and the ability to
produce estimates comparable with the published field erosion measurements. The
calculation of individual factors is described in more detail in the following
subsubsections.
RUSLE is the technique most extensively used globally to predict the long-term
rate of erosion. Wischmeier and Smith (1965) from the US Department of Agriculture
first developed the Universal Soil Loss Equation (USLE) as a field-scale model
(Wall et al. 2002). In 1997, it was revised to better assess the values of different factors in USLE (Renard et al. 1997). Since then, the RUSLE model has been well
studied and extensively used to estimate soil erosion in the areas under consideration
at different scales (Ganasri and Ramesh 2016; Karamage et al. 2016; Lee et al.
2017; Mukanov et al. 2019; Nyesheja et al. 2018; Prasannakumar et al. 2012).
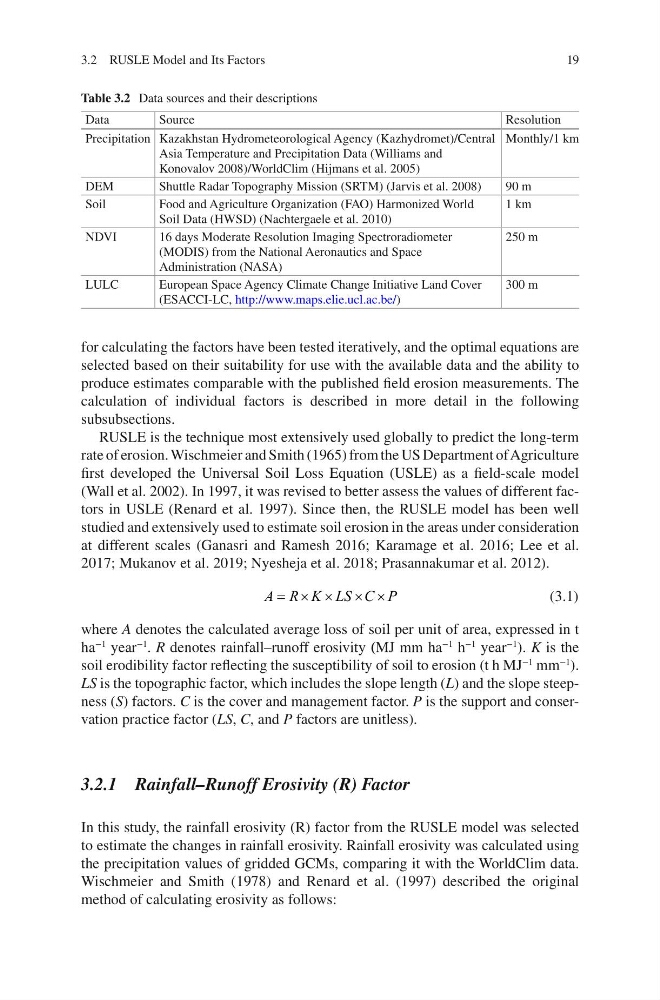
A R K LS C P
u u u u
(3.1)
where A denotes the calculated average loss of soil per unit of area, expressed in t
ha
−1
year
−1
. R denotes rainfall–runoff erosivity (MJ mm ha
−1
h
−1
year
−1
). K is the
soil erodibility factor reflecting the susceptibility of soil to erosion (t h MJ
−1
mm
−1
).
LS is the topographic factor, which includes the slope length (L) and the slope steepness (S) factors. C is the cover and management factor. P is the support and conservation practice factor (LS, C, and P factors are unitless).
3.2.1 Rainfall–Runoff Erosivity (R) Factor
In this study, the rainfall erosivity (R) factor from the RUSLE model was selected
to estimate the changes in rainfall erosivity. Rainfall erosivity was calculated using
the precipitation values of gridded GCMs, comparing it with the WorldClim data.
Wischmeier and Smith (1978) and Renard et al. (1997) described the original
method of calculating erosivity as follows:
Table 3.2 Data sources and their descriptions
Data
Source
Resolution
Precipitation Kazakhstan Hydrometeorological Agency (Kazhydromet)/Central
Asia Temperature and Precipitation Data (Williams and
Konovalov 2008)/WorldClim (Hijmans et al. 2005)
Monthly/1 km
DEM
Shuttle Radar Topography Mission (SRTM) (Jarvis et al. 2008)
90 m
Soil
Food and Agriculture Organization (FAO) Harmonized World
Soil Data (HWSD) (Nachtergaele et al. 2010)
1 km
NDVI
16 days Moderate Resolution Imaging Spectroradiometer
(MODIS) from the National Aeronautics and Space
Administration (NASA)
250 m
LULC
European Space Agency Climate Change Initiative Land Cover
(ESACCI-LC, http://www.maps.elie.ucl.ac.be/)
300 m
3.2 RUSLE Model and Its Factors
for calculating the factors have been tested iteratively, and the optimal equations are
selected based on their suitability for use with the available data and the ability to
produce estimates comparable with the published field erosion measurements. The
calculation of individual factors is described in more detail in the following
subsubsections.
RUSLE is the technique most extensively used globally to predict the long-term
rate of erosion. Wischmeier and Smith (1965) from the US Department of Agriculture
first developed the Universal Soil Loss Equation (USLE) as a field-scale model
(Wall et al. 2002). In 1997, it was revised to better assess the values of different factors in USLE (Renard et al. 1997). Since then, the RUSLE model has been well
studied and extensively used to estimate soil erosion in the areas under consideration
at different scales (Ganasri and Ramesh 2016; Karamage et al. 2016; Lee et al.
2017; Mukanov et al. 2019; Nyesheja et al. 2018; Prasannakumar et al. 2012).
A R K LS C P
u u u u
(3.1)
where A denotes the calculated average loss of soil per unit of area, expressed in t
ha
−1
year
−1
. R denotes rainfall–runoff erosivity (MJ mm ha
−1
h
−1
year
−1
). K is the
soil erodibility factor reflecting the susceptibility of soil to erosion (t h MJ
−1
mm
−1
).
LS is the topographic factor, which includes the slope length (L) and the slope steepness (S) factors. C is the cover and management factor. P is the support and conservation practice factor (LS, C, and P factors are unitless).
3.2.1 Rainfall–Runoff Erosivity (R) Factor
In this study, the rainfall erosivity (R) factor from the RUSLE model was selected
to estimate the changes in rainfall erosivity. Rainfall erosivity was calculated using
the precipitation values of gridded GCMs, comparing it with the WorldClim data.
Wischmeier and Smith (1978) and Renard et al. (1997) described the original
method of calculating erosivity as follows:
Table 3.2 Data sources and their descriptions
Data
Source
Resolution
Precipitation Kazakhstan Hydrometeorological Agency (Kazhydromet)/Central
Asia Temperature and Precipitation Data (Williams and
Konovalov 2008)/WorldClim (Hijmans et al. 2005)
Monthly/1 km
DEM
Shuttle Radar Topography Mission (SRTM) (Jarvis et al. 2008)
90 m
Soil
Food and Agriculture Organization (FAO) Harmonized World
Soil Data (HWSD) (Nachtergaele et al. 2010)
1 km
NDVI
16 days Moderate Resolution Imaging Spectroradiometer
(MODIS) from the National Aeronautics and Space
Administration (NASA)
250 m
LULC
European Space Agency Climate Change Initiative Land Cover
(ESACCI-LC, http://www.maps.elie.ucl.ac.be/)
300 m
3.2 RUSLE Model and Its Factors