

130
the first inkling that many people had of the vast scale of oil and gas production
from the Bakken, and it was something of a thirty-day wonder.
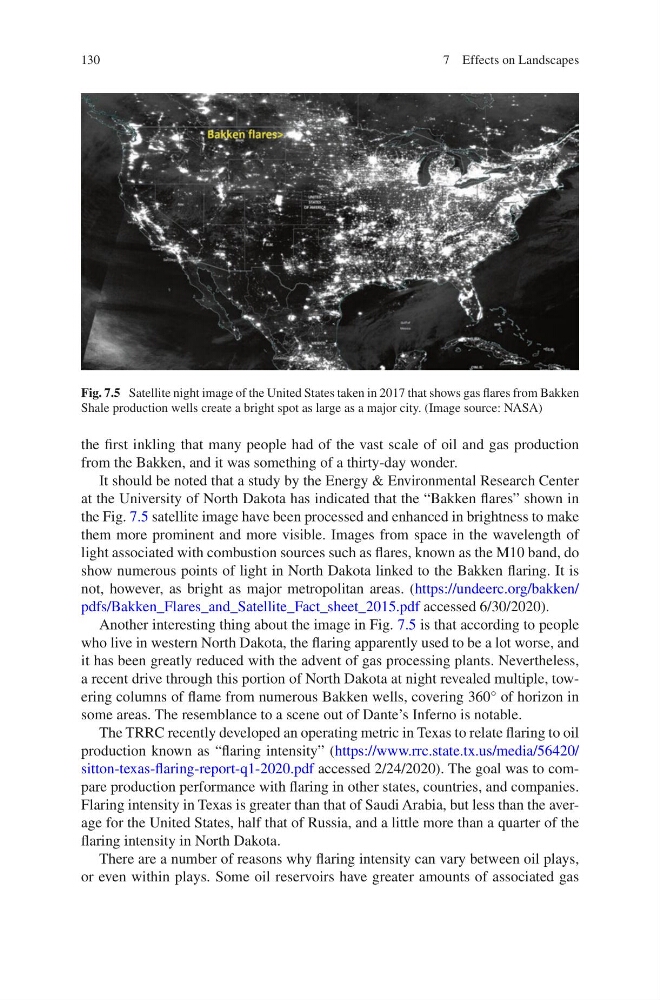
It should be noted that a study by the Energy & Environmental Research Center
at the University of North Dakota has indicated that the “Bakken flares” shown in
the Fig. 7.5 satellite image have been processed and enhanced in brightness to make
them more prominent and more visible. Images from space in the wavelength of
light associated with combustion sources such as flares, known as the M10 band, do
show numerous points of light in North Dakota linked to the Bakken flaring. It is
not, however, as bright as major metropolitan areas. (https://undeerc.org/bakken/
pdfs/Bakken_Flares_and_Satellite_Fact_sheet_2015.pdf accessed 6/30/2020).
Another interesting thing about the image in Fig. 7.5 is that according to people
who live in western North Dakota, the flaring apparently used to be a lot worse, and
it has been greatly reduced with the advent of gas processing plants. Nevertheless,
a recent drive through this portion of North Dakota at night revealed multiple, towering columns of flame from numerous Bakken wells, covering 360° of horizon in
some areas. The resemblance to a scene out of Dante’s Inferno is notable.
The TRRC recently developed an operating metric in Texas to relate flaring to oil
production known as “flaring intensity” (https://www.rrc.state.tx.us/media/56420/
sitton-texas-flaring-report-q1-2020.pdf accessed 2/24/2020). The goal was to compare production performance with flaring in other states, countries, and companies.
Flaring intensity in Texas is greater than that of Saudi Arabia, but less than the average for the United States, half that of Russia, and a little more than a quarter of the
flaring intensity in North Dakota.
There are a number of reasons why flaring intensity can vary between oil plays,
or even within plays. Some oil reservoirs have greater amounts of associated gas
Fig. 7.5 Satellite night image of the United States taken in 2017 that shows gas flares from Bakken
Shale production wells create a bright spot as large as a major city. (Image source: NASA)
7 Effects on Landscapes
the first inkling that many people had of the vast scale of oil and gas production
from the Bakken, and it was something of a thirty-day wonder.
It should be noted that a study by the Energy & Environmental Research Center
at the University of North Dakota has indicated that the “Bakken flares” shown in
the Fig. 7.5 satellite image have been processed and enhanced in brightness to make
them more prominent and more visible. Images from space in the wavelength of
light associated with combustion sources such as flares, known as the M10 band, do
show numerous points of light in North Dakota linked to the Bakken flaring. It is
not, however, as bright as major metropolitan areas. (https://undeerc.org/bakken/
pdfs/Bakken_Flares_and_Satellite_Fact_sheet_2015.pdf accessed 6/30/2020).
Another interesting thing about the image in Fig. 7.5 is that according to people
who live in western North Dakota, the flaring apparently used to be a lot worse, and
it has been greatly reduced with the advent of gas processing plants. Nevertheless,
a recent drive through this portion of North Dakota at night revealed multiple, towering columns of flame from numerous Bakken wells, covering 360° of horizon in
some areas. The resemblance to a scene out of Dante’s Inferno is notable.
The TRRC recently developed an operating metric in Texas to relate flaring to oil
production known as “flaring intensity” (https://www.rrc.state.tx.us/media/56420/
sitton-texas-flaring-report-q1-2020.pdf accessed 2/24/2020). The goal was to compare production performance with flaring in other states, countries, and companies.
Flaring intensity in Texas is greater than that of Saudi Arabia, but less than the average for the United States, half that of Russia, and a little more than a quarter of the
flaring intensity in North Dakota.
There are a number of reasons why flaring intensity can vary between oil plays,
or even within plays. Some oil reservoirs have greater amounts of associated gas
Fig. 7.5 Satellite night image of the United States taken in 2017 that shows gas flares from Bakken
Shale production wells create a bright spot as large as a major city. (Image source: NASA)
7 Effects on Landscapes