

6 Heat Vulnerability Index Development and Application in Medan City, Indonesia
93
where t is maximum temperature (°C), RH is relative humidity (%), Tmrt is mean
radiant temperature (°C), and v is wind speed (m/s) (Fiala et al. 2012). UTCI is using
the following assumptions: walk 4 km/h, weight 74 kg, and metabolic rate 135 W/m
2 .
Calculating the UTCI was conducted in few steps. Firstly, solar radiation was
calculated (i.e., conversion from t, sunshine duration and RH to solar radiation) by
equation given by Garg and Garg (1983), and the solar radiation was used to calculate Tmrt with Bioklima package 2.6 (https://www.igipz.pan.pl/Bioklima-zgik.html).
Using the same package, the overall UTCI was calculated. For tropical countries,
UTCI was divided into five classes; no thermal stress (9–26 °C), moderate heat stress
(26–32 °C), strong heat stress (32–38 °C), very strong heat stress (38–46 °C), and
extreme heat stress (above 46 °C) (Fiala et al. 2012).
6.7 Urban Heat Island
The Urban Heat Island was estimated by six representative variables, namely vegetation coverage, building coverage, Land Surface Temperature (LST), electricity and
gas consumptions from several sources (i.e., industry, residential, office, department
store and school), and oil consumption from land transportation (i.e., car, motorcycle, bus, and truck). Building contributes to the UHI because of their large thermal
capacity, which is exposed to the sun through the roof and the wall, and through the
heat dissipated because of space conditioning, electricity loads, and metabolic heat
generation from the occupants (Phelan et al. 2015).
6.8 Vegetation and Building Coverage
High building density is associated with an increased heat-rellated illness and deaths
(Hondula et al. 2012). It is caused by unshaded area increasing exposure to direct
sunshine, and reduced outdoor space limiting natural air ventilation. Vegetation and
building coverage area were sourced from satellite images captured by Landsat Operational Land Imager (OLI) 8 data and acquired from United States Geological Survey
(http://www.usgs.gov). The images were processed in ArcMap 10.3 (ESRI), and
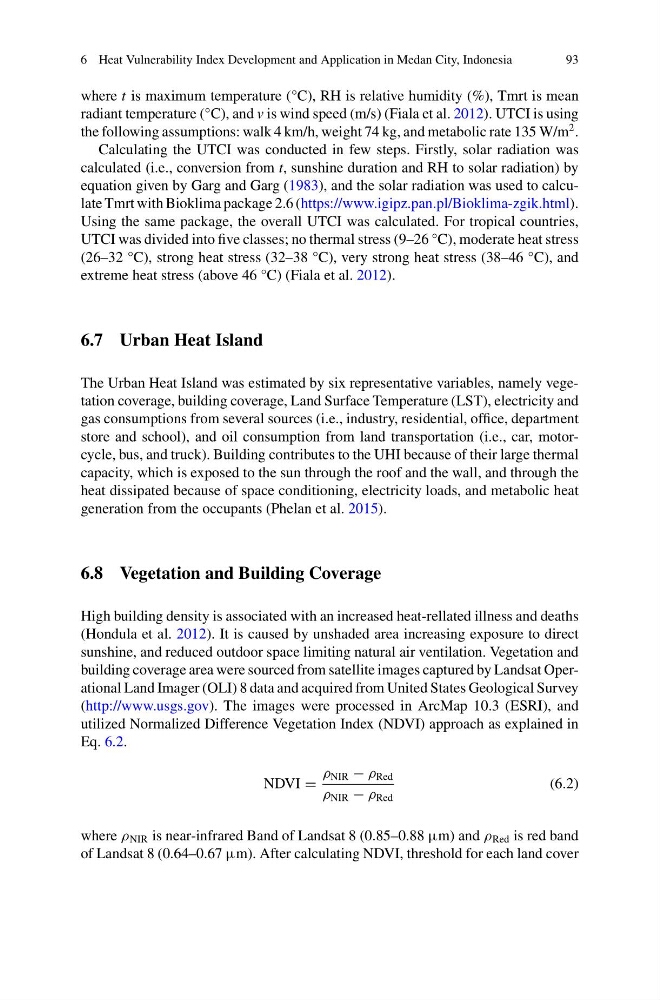
utilized Normalized Difference Vegetation Index (NDVI) approach as explained in
Eq. 6.2.
NDVI =
ρ NIR − ρ Red
ρ NIR − ρ Red
(6.2)
where ρ NIR is near-infrared Band of Landsat 8 (0.85–0.88 μm) and ρ Red is red band
of Landsat 8 (0.64–0.67 μm). After calculating NDVI, threshold for each land cover
93
where t is maximum temperature (°C), RH is relative humidity (%), Tmrt is mean
radiant temperature (°C), and v is wind speed (m/s) (Fiala et al. 2012). UTCI is using
the following assumptions: walk 4 km/h, weight 74 kg, and metabolic rate 135 W/m
2 .
Calculating the UTCI was conducted in few steps. Firstly, solar radiation was
calculated (i.e., conversion from t, sunshine duration and RH to solar radiation) by
equation given by Garg and Garg (1983), and the solar radiation was used to calculate Tmrt with Bioklima package 2.6 (https://www.igipz.pan.pl/Bioklima-zgik.html).
Using the same package, the overall UTCI was calculated. For tropical countries,
UTCI was divided into five classes; no thermal stress (9–26 °C), moderate heat stress
(26–32 °C), strong heat stress (32–38 °C), very strong heat stress (38–46 °C), and
extreme heat stress (above 46 °C) (Fiala et al. 2012).
6.7 Urban Heat Island
The Urban Heat Island was estimated by six representative variables, namely vegetation coverage, building coverage, Land Surface Temperature (LST), electricity and
gas consumptions from several sources (i.e., industry, residential, office, department
store and school), and oil consumption from land transportation (i.e., car, motorcycle, bus, and truck). Building contributes to the UHI because of their large thermal
capacity, which is exposed to the sun through the roof and the wall, and through the
heat dissipated because of space conditioning, electricity loads, and metabolic heat
generation from the occupants (Phelan et al. 2015).
6.8 Vegetation and Building Coverage
High building density is associated with an increased heat-rellated illness and deaths
(Hondula et al. 2012). It is caused by unshaded area increasing exposure to direct
sunshine, and reduced outdoor space limiting natural air ventilation. Vegetation and
building coverage area were sourced from satellite images captured by Landsat Operational Land Imager (OLI) 8 data and acquired from United States Geological Survey
(http://www.usgs.gov). The images were processed in ArcMap 10.3 (ESRI), and
utilized Normalized Difference Vegetation Index (NDVI) approach as explained in
Eq. 6.2.
NDVI =
ρ NIR − ρ Red
ρ NIR − ρ Red
(6.2)
where ρ NIR is near-infrared Band of Landsat 8 (0.85–0.88 μm) and ρ Red is red band
of Landsat 8 (0.64–0.67 μm). After calculating NDVI, threshold for each land cover