

4 Classifying the Forest Surfaces in Metropolitan Areas …
61
Similarly, certain points could be highlighted discussing the maps belonging to
meteorological and geomorphological criteria. For example, there exist remarkable
similarity between the map of maximum temperature (E3) and altitude (P3). This
is explainable based on the assumption that the higher the altitude the lower the
temperature. Another resemblance occurs between the maps of wind speed (E4) and
slope (P1).
The next challenge is to merge the individual values into a single cumulative
multi-criterion indexing map by considering their relative impact to either ignition or
spreading phase of the wildfire event. As previously introduced, the weighted values
are generated via AHP pairwise comparison method. Since AHP is based on personal
evaluation and a certain subjectivity is generally accepted, in this study the final
values are calculated as the average values among eight respondents (Fig. 4.3) being
professionals in the field of Disaster Risk Management and Fire Safety (DRM&FS).
Beyond the subjectivity of the responses, the study is more a methodical proposal
than a weighted values set. Yet, the weighted factors can be further improved at
least by enhancing the number of the respondents as well as their professional level
and profile diversity. Moreover, AHP weighting procedure can become further inclusive and holistic, by integrating respondents from other stakeholder profiles such as
inhabitants, fire-fighting teams, farmers, governing bodies. The individual evaluations could be easily checked about their Consistency Ratio (CR) by semi-automated
AHP excel template as developed by Goepel (2013).
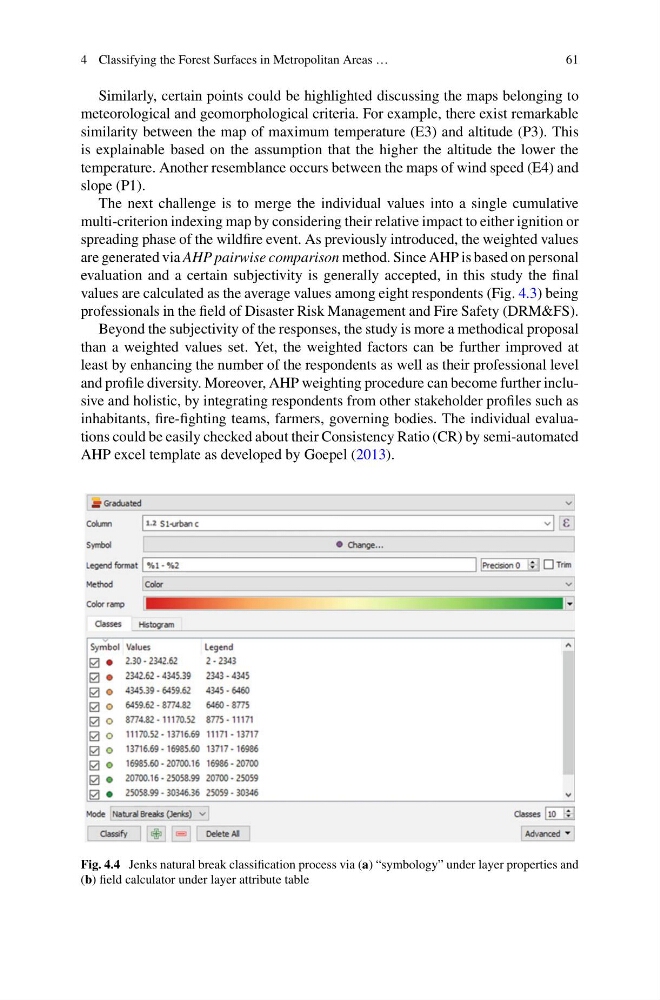
Fig. 4.4 Jenks natural break classification process via (a) “symbology” under layer properties and
(b) field calculator under layer attribute table
61
Similarly, certain points could be highlighted discussing the maps belonging to
meteorological and geomorphological criteria. For example, there exist remarkable
similarity between the map of maximum temperature (E3) and altitude (P3). This
is explainable based on the assumption that the higher the altitude the lower the
temperature. Another resemblance occurs between the maps of wind speed (E4) and
slope (P1).
The next challenge is to merge the individual values into a single cumulative
multi-criterion indexing map by considering their relative impact to either ignition or
spreading phase of the wildfire event. As previously introduced, the weighted values
are generated via AHP pairwise comparison method. Since AHP is based on personal
evaluation and a certain subjectivity is generally accepted, in this study the final
values are calculated as the average values among eight respondents (Fig. 4.3) being
professionals in the field of Disaster Risk Management and Fire Safety (DRM&FS).
Beyond the subjectivity of the responses, the study is more a methodical proposal
than a weighted values set. Yet, the weighted factors can be further improved at
least by enhancing the number of the respondents as well as their professional level
and profile diversity. Moreover, AHP weighting procedure can become further inclusive and holistic, by integrating respondents from other stakeholder profiles such as
inhabitants, fire-fighting teams, farmers, governing bodies. The individual evaluations could be easily checked about their Consistency Ratio (CR) by semi-automated
AHP excel template as developed by Goepel (2013).
Fig. 4.4 Jenks natural break classification process via (a) “symbology” under layer properties and
(b) field calculator under layer attribute table