

58
A. Hysa
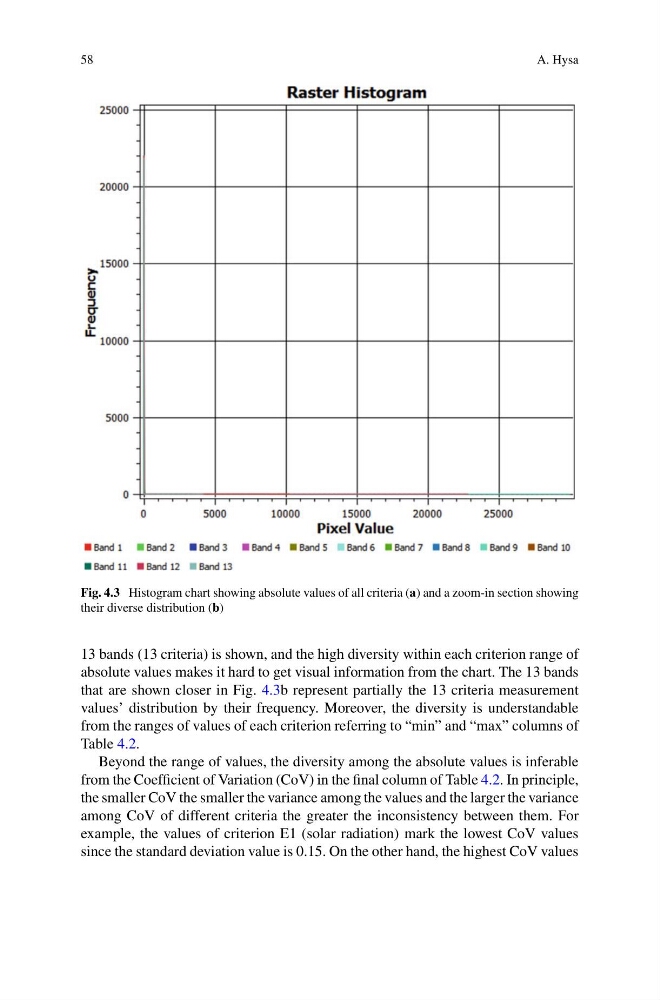
Fig. 4.3 Histogram chart showing absolute values of all criteria (a) and a zoom-in section showing
their diverse distribution (b)
13 bands (13 criteria) is shown, and the high diversity within each criterion range of
absolute values makes it hard to get visual information from the chart. The 13 bands
that are shown closer in Fig. 4.3b represent partially the 13 criteria measurement
values’ distribution by their frequency. Moreover, the diversity is understandable
from the ranges of values of each criterion referring to “min” and “max” columns of
Table 4.2.
Beyond the range of values, the diversity among the absolute values is inferable
from the Coefficient of Variation (CoV) in the final column of Table 4.2. In principle,
the smaller CoV the smaller the variance among the values and the larger the variance
among CoV of different criteria the greater the inconsistency between them. For
example, the values of criterion E1 (solar radiation) mark the lowest CoV values
since the standard deviation value is 0.15. On the other hand, the highest CoV values
A. Hysa
Fig. 4.3 Histogram chart showing absolute values of all criteria (a) and a zoom-in section showing
their diverse distribution (b)
13 bands (13 criteria) is shown, and the high diversity within each criterion range of
absolute values makes it hard to get visual information from the chart. The 13 bands
that are shown closer in Fig. 4.3b represent partially the 13 criteria measurement
values’ distribution by their frequency. Moreover, the diversity is understandable
from the ranges of values of each criterion referring to “min” and “max” columns of
Table 4.2.
Beyond the range of values, the diversity among the absolute values is inferable
from the Coefficient of Variation (CoV) in the final column of Table 4.2. In principle,
the smaller CoV the smaller the variance among the values and the larger the variance
among CoV of different criteria the greater the inconsistency between them. For
example, the values of criterion E1 (solar radiation) mark the lowest CoV values
since the standard deviation value is 0.15. On the other hand, the highest CoV values