

150
H. Matsuura
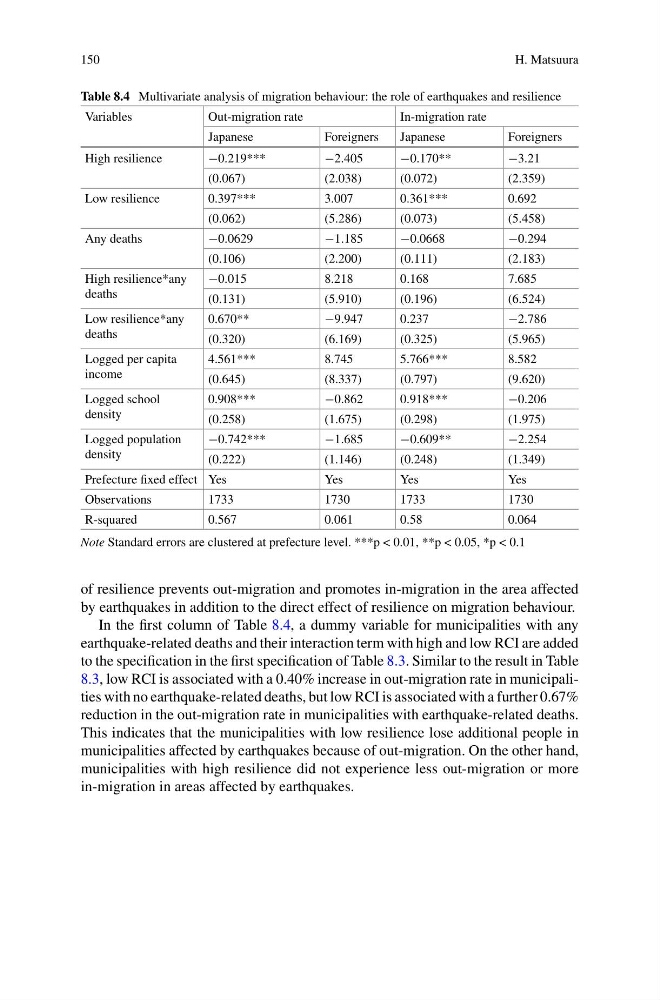
Table 8.4 Multivariate analysis of migration behaviour: the role of earthquakes and resilience
Variables
Out-migration rate
In-migration rate
Japanese
Foreigners
Japanese
Foreigners
High resilience
−0.219***
−2.405
−0.170**
−3.21
(0.067)
(2.038)
(0.072)
(2.359)
Low resilience
0.397***
3.007
0.361***
0.692
(0.062)
(5.286)
(0.073)
(5.458)
Any deaths
−0.0629
−1.185
−0.0668
−0.294
(0.106)
(2.200)
(0.111)
(2.183)
High resilience*any
deaths
−0.015
8.218
0.168
7.685
(0.131)
(5.910)
(0.196)
(6.524)
Low resilience*any
deaths
0.670**
−9.947
0.237
−2.786
(0.320)
(6.169)
(0.325)
(5.965)
Logged per capita
income
4.561***
8.745
5.766***
8.582
(0.645)
(8.337)
(0.797)
(9.620)
Logged school
density
0.908***
−0.862
0.918***
−0.206
(0.258)
(1.675)
(0.298)
(1.975)
Logged population
density
−0.742***
−1.685
−0.609**
−2.254
(0.222)
(1.146)
(0.248)
(1.349)
Prefecture fixed effect Yes
Yes
Yes
Yes
Observations
1733
1730
1733
1730
R-squared
0.567
0.061
0.58
0.064
Note Standard errors are clustered at prefecture level. ***p < 0.01, **p < 0.05, *p < 0.1
of resilience prevents out-migration and promotes in-migration in the area affected
by earthquakes in addition to the direct effect of resilience on migration behaviour.
In the first column of Table 8.4, a dummy variable for municipalities with any
earthquake-related deaths and their interaction term with high and low RCI are added
to the specification in the first specification of Table 8.3. Similar to the result in Table
8.3, low RCI is associated with a 0.40% increase in out-migration rate in municipalities with no earthquake-related deaths, but low RCI is associated with a further 0.67%
reduction in the out-migration rate in municipalities with earthquake-related deaths.
This indicates that the municipalities with low resilience lose additional people in
municipalities affected by earthquakes because of out-migration. On the other hand,
municipalities with high resilience did not experience less out-migration or more
in-migration in areas affected by earthquakes.
H. Matsuura
Table 8.4 Multivariate analysis of migration behaviour: the role of earthquakes and resilience
Variables
Out-migration rate
In-migration rate
Japanese
Foreigners
Japanese
Foreigners
High resilience
−0.219***
−2.405
−0.170**
−3.21
(0.067)
(2.038)
(0.072)
(2.359)
Low resilience
0.397***
3.007
0.361***
0.692
(0.062)
(5.286)
(0.073)
(5.458)
Any deaths
−0.0629
−1.185
−0.0668
−0.294
(0.106)
(2.200)
(0.111)
(2.183)
High resilience*any
deaths
−0.015
8.218
0.168
7.685
(0.131)
(5.910)
(0.196)
(6.524)
Low resilience*any
deaths
0.670**
−9.947
0.237
−2.786
(0.320)
(6.169)
(0.325)
(5.965)
Logged per capita
income
4.561***
8.745
5.766***
8.582
(0.645)
(8.337)
(0.797)
(9.620)
Logged school
density
0.908***
−0.862
0.918***
−0.206
(0.258)
(1.675)
(0.298)
(1.975)
Logged population
density
−0.742***
−1.685
−0.609**
−2.254
(0.222)
(1.146)
(0.248)
(1.349)
Prefecture fixed effect Yes
Yes
Yes
Yes
Observations
1733
1730
1733
1730
R-squared
0.567
0.061
0.58
0.064
Note Standard errors are clustered at prefecture level. ***p < 0.01, **p < 0.05, *p < 0.1
of resilience prevents out-migration and promotes in-migration in the area affected
by earthquakes in addition to the direct effect of resilience on migration behaviour.
In the first column of Table 8.4, a dummy variable for municipalities with any
earthquake-related deaths and their interaction term with high and low RCI are added
to the specification in the first specification of Table 8.3. Similar to the result in Table
8.3, low RCI is associated with a 0.40% increase in out-migration rate in municipalities with no earthquake-related deaths, but low RCI is associated with a further 0.67%
reduction in the out-migration rate in municipalities with earthquake-related deaths.
This indicates that the municipalities with low resilience lose additional people in
municipalities affected by earthquakes because of out-migration. On the other hand,
municipalities with high resilience did not experience less out-migration or more
in-migration in areas affected by earthquakes.