

146
H. Matsuura
Table 8.1 (continued)
Variable
Year
N
Mean Std. Dev Min
Max
Out-migration rate:
Foreigner
1738 24.42 37.02
0.00
714.47
In-migration rate:
Japanese
1741 3.33
1.54
0.76
17.20
In-migration rate:
Foreigner
1738 33.22 37.57
0.00
712.03
Per capita taxable income 2013
1741 2747
481
1213
9017
School density
2013
1741 0.27
0.56
0
8.60
Population density
2013
1741 1026
2356
2
19,367
* There are 1741 municipalities in Japan as of 2016. I calculate Resilience Capacity Index
(RCI) unless each of the three dimensions (Economic capacity, Socio-demographic Capacity, and
Community connectivity) of RCI has missing values in more than two variables. As a result, RCI
is calculated for the 1735 municipalities
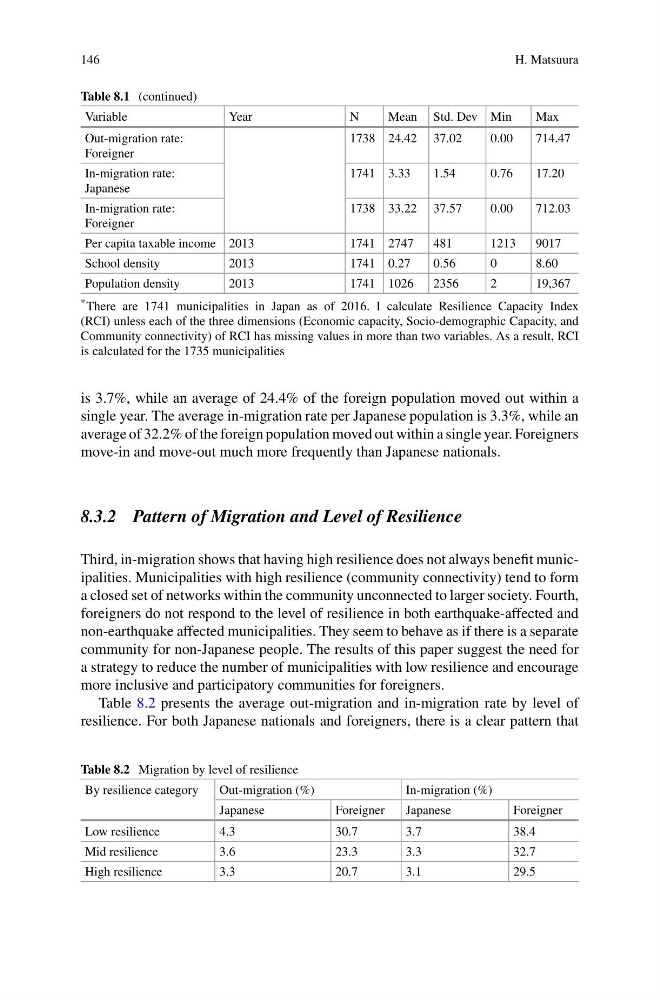
is 3.7%, while an average of 24.4% of the foreign population moved out within a
single year. The average in-migration rate per Japanese population is 3.3%, while an
average of 32.2% of the foreign population moved out within a single year. Foreigners
move-in and move-out much more frequently than Japanese nationals.
8.3.2 Pattern of Migration and Level of Resilience
Third, in-migration shows that having high resilience does not always benefit municipalities. Municipalities with high resilience (community connectivity) tend to form
a closed set of networks within the community unconnected to larger society. Fourth,
foreigners do not respond to the level of resilience in both earthquake-affected and
non-earthquake affected municipalities. They seem to behave as if there is a separate
community for non-Japanese people. The results of this paper suggest the need for
a strategy to reduce the number of municipalities with low resilience and encourage
more inclusive and participatory communities for foreigners.
Table 8.2 presents the average out-migration and in-migration rate by level of
resilience. For both Japanese nationals and foreigners, there is a clear pattern that
Table 8.2 Migration by level of resilience
By resilience category
Out-migration (%)
In-migration (%)
Japanese
Foreigner
Japanese
Foreigner
Low resilience
4.3
30.7
3.7
38.4
Mid resilience
3.6
23.3
3.3
32.7
High resilience
3.3
20.7
3.1
29.5
H. Matsuura
Table 8.1 (continued)
Variable
Year
N
Mean Std. Dev Min
Max
Out-migration rate:
Foreigner
1738 24.42 37.02
0.00
714.47
In-migration rate:
Japanese
1741 3.33
1.54
0.76
17.20
In-migration rate:
Foreigner
1738 33.22 37.57
0.00
712.03
Per capita taxable income 2013
1741 2747
481
1213
9017
School density
2013
1741 0.27
0.56
0
8.60
Population density
2013
1741 1026
2356
2
19,367
* There are 1741 municipalities in Japan as of 2016. I calculate Resilience Capacity Index
(RCI) unless each of the three dimensions (Economic capacity, Socio-demographic Capacity, and
Community connectivity) of RCI has missing values in more than two variables. As a result, RCI
is calculated for the 1735 municipalities
is 3.7%, while an average of 24.4% of the foreign population moved out within a
single year. The average in-migration rate per Japanese population is 3.3%, while an
average of 32.2% of the foreign population moved out within a single year. Foreigners
move-in and move-out much more frequently than Japanese nationals.
8.3.2 Pattern of Migration and Level of Resilience
Third, in-migration shows that having high resilience does not always benefit municipalities. Municipalities with high resilience (community connectivity) tend to form
a closed set of networks within the community unconnected to larger society. Fourth,
foreigners do not respond to the level of resilience in both earthquake-affected and
non-earthquake affected municipalities. They seem to behave as if there is a separate
community for non-Japanese people. The results of this paper suggest the need for
a strategy to reduce the number of municipalities with low resilience and encourage
more inclusive and participatory communities for foreigners.
Table 8.2 presents the average out-migration and in-migration rate by level of
resilience. For both Japanese nationals and foreigners, there is a clear pattern that
Table 8.2 Migration by level of resilience
By resilience category
Out-migration (%)
In-migration (%)
Japanese
Foreigner
Japanese
Foreigner
Low resilience
4.3
30.7
3.7
38.4
Mid resilience
3.6
23.3
3.3
32.7
High resilience
3.3
20.7
3.1
29.5