

8 Level of Disaster Resilience and Migration …
143
3
3.5
4
4.5
5
2009
2010
2011
2012
2013
2014
2015
2016
Out-migraaon: disaster not affected
Out-migraaon: disaster affected
In-migraaon: disaster not affected
In-migraaon: disaster affected
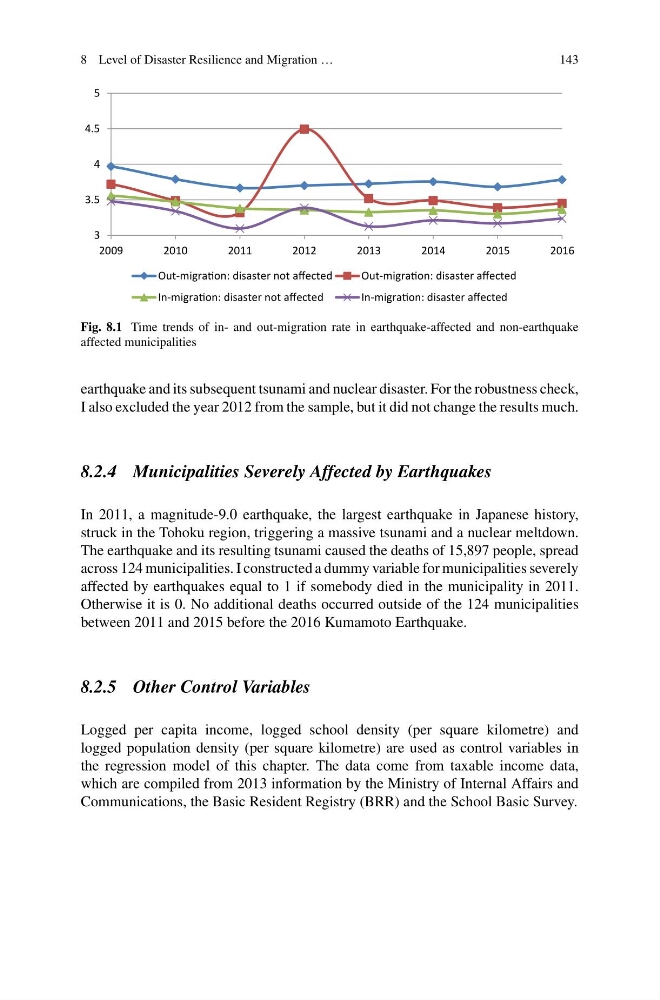
Fig. 8.1 Time trends of in- and out-migration rate in earthquake-affected and non-earthquake
affected municipalities
earthquake and its subsequent tsunami and nuclear disaster. For the robustness check,
I also excluded the year 2012 from the sample, but it did not change the results much.
8.2.4 Municipalities Severely Affected by Earthquakes
In 2011, a magnitude-9.0 earthquake, the largest earthquake in Japanese history,
struck in the Tohoku region, triggering a massive tsunami and a nuclear meltdown.
The earthquake and its resulting tsunami caused the deaths of 15,897 people, spread
across 124 municipalities. I constructed a dummy variable for municipalities severely
affected by earthquakes equal to 1 if somebody died in the municipality in 2011.
Otherwise it is 0. No additional deaths occurred outside of the 124 municipalities
between 2011 and 2015 before the 2016 Kumamoto Earthquake.
8.2.5 Other Control Variables
Logged per capita income, logged school density (per square kilometre) and
logged population density (per square kilometre) are used as control variables in
the regression model of this chapter. The data come from taxable income data,
which are compiled from 2013 information by the Ministry of Internal Affairs and
Communications, the Basic Resident Registry (BRR) and the School Basic Survey.
143
3
3.5
4
4.5
5
2009
2010
2011
2012
2013
2014
2015
2016
Out-migraaon: disaster not affected
Out-migraaon: disaster affected
In-migraaon: disaster not affected
In-migraaon: disaster affected
Fig. 8.1 Time trends of in- and out-migration rate in earthquake-affected and non-earthquake
affected municipalities
earthquake and its subsequent tsunami and nuclear disaster. For the robustness check,
I also excluded the year 2012 from the sample, but it did not change the results much.
8.2.4 Municipalities Severely Affected by Earthquakes
In 2011, a magnitude-9.0 earthquake, the largest earthquake in Japanese history,
struck in the Tohoku region, triggering a massive tsunami and a nuclear meltdown.
The earthquake and its resulting tsunami caused the deaths of 15,897 people, spread
across 124 municipalities. I constructed a dummy variable for municipalities severely
affected by earthquakes equal to 1 if somebody died in the municipality in 2011.
Otherwise it is 0. No additional deaths occurred outside of the 124 municipalities
between 2011 and 2015 before the 2016 Kumamoto Earthquake.
8.2.5 Other Control Variables
Logged per capita income, logged school density (per square kilometre) and
logged population density (per square kilometre) are used as control variables in
the regression model of this chapter. The data come from taxable income data,
which are compiled from 2013 information by the Ministry of Internal Affairs and
Communications, the Basic Resident Registry (BRR) and the School Basic Survey.