

7 Comparative GIS-Based Assessment …
125
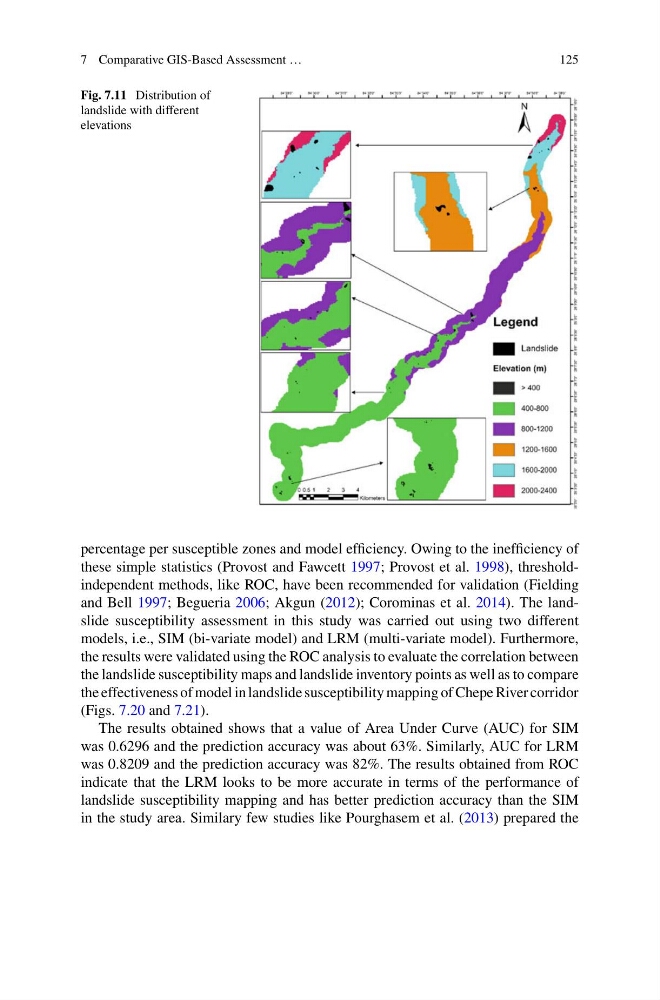
Fig. 7.11 Distribution of
landslide with different
elevations
percentage per susceptible zones and model efficiency. Owing to the inefficiency of
these simple statistics (Provost and Fawcett 1997; Provost et al. 1998), thresholdindependent methods, like ROC, have been recommended for validation (Fielding
and Bell 1997; Begueria 2006; Akgun (2012); Corominas et al. 2014). The landslide susceptibility assessment in this study was carried out using two different
models, i.e., SIM (bi-variate model) and LRM (multi-variate model). Furthermore,
the results were validated using the ROC analysis to evaluate the correlation between
the landslide susceptibility maps and landslide inventory points as well as to compare
the effectiveness of model in landslide susceptibility mapping of Chepe River corridor
(Figs. 7.20 and 7.21).
The results obtained shows that a value of Area Under Curve (AUC) for SIM
was 0.6296 and the prediction accuracy was about 63%. Similarly, AUC for LRM
was 0.8209 and the prediction accuracy was 82%. The results obtained from ROC
indicate that the LRM looks to be more accurate in terms of the performance of
landslide susceptibility mapping and has better prediction accuracy than the SIM
in the study area. Similary few studies like Pourghasem et al. (2013) prepared the
125
Fig. 7.11 Distribution of
landslide with different
elevations
percentage per susceptible zones and model efficiency. Owing to the inefficiency of
these simple statistics (Provost and Fawcett 1997; Provost et al. 1998), thresholdindependent methods, like ROC, have been recommended for validation (Fielding
and Bell 1997; Begueria 2006; Akgun (2012); Corominas et al. 2014). The landslide susceptibility assessment in this study was carried out using two different
models, i.e., SIM (bi-variate model) and LRM (multi-variate model). Furthermore,
the results were validated using the ROC analysis to evaluate the correlation between
the landslide susceptibility maps and landslide inventory points as well as to compare
the effectiveness of model in landslide susceptibility mapping of Chepe River corridor
(Figs. 7.20 and 7.21).
The results obtained shows that a value of Area Under Curve (AUC) for SIM
was 0.6296 and the prediction accuracy was about 63%. Similarly, AUC for LRM
was 0.8209 and the prediction accuracy was 82%. The results obtained from ROC
indicate that the LRM looks to be more accurate in terms of the performance of
landslide susceptibility mapping and has better prediction accuracy than the SIM
in the study area. Similary few studies like Pourghasem et al. (2013) prepared the